
Fichas
Chapter 7: The Normal Distribution
Fichas del conjunto (15)
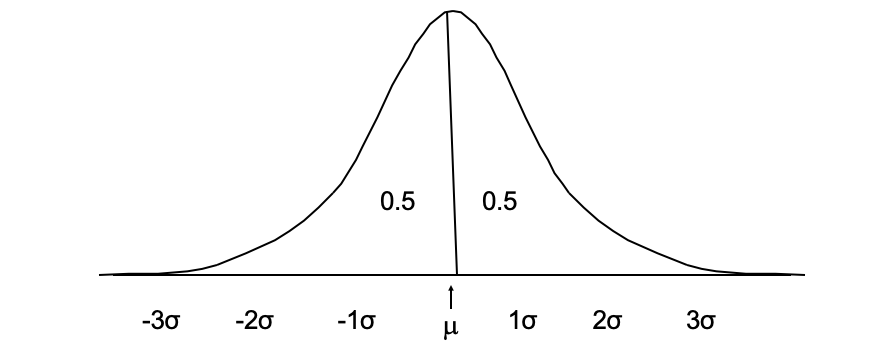
- 1The Normal CurveA bell shaped density curve centered at its mean (mu).
- 2Normal Distribution
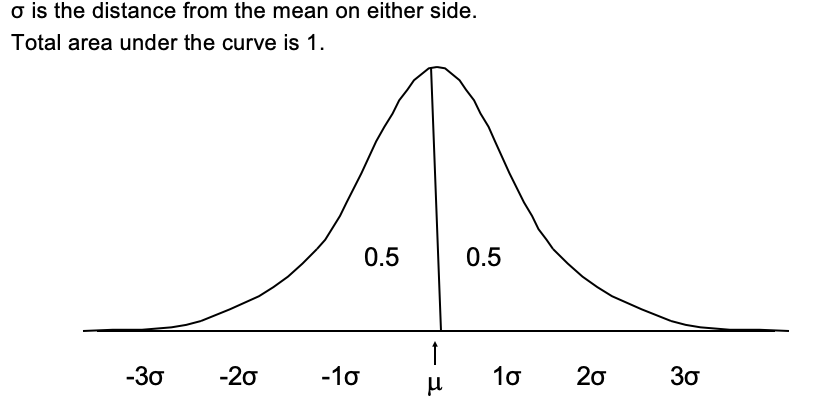
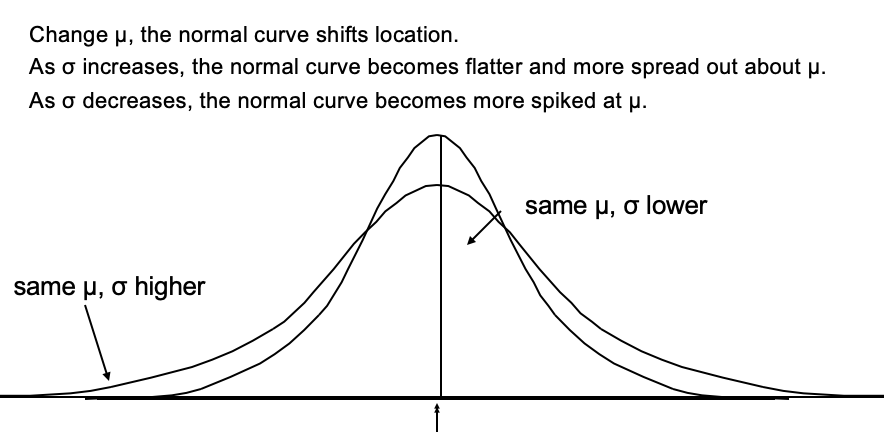
- 3Aspects of a Normal Distribution
- 4Importance of Normal Distribution1. Used to determine the probability that a measurement of a normal random variable falls in a particular interval
2. Used to determine the area under the curve in a certain interval or the proportion (or percentage) of the measurements that fall in a certain interval
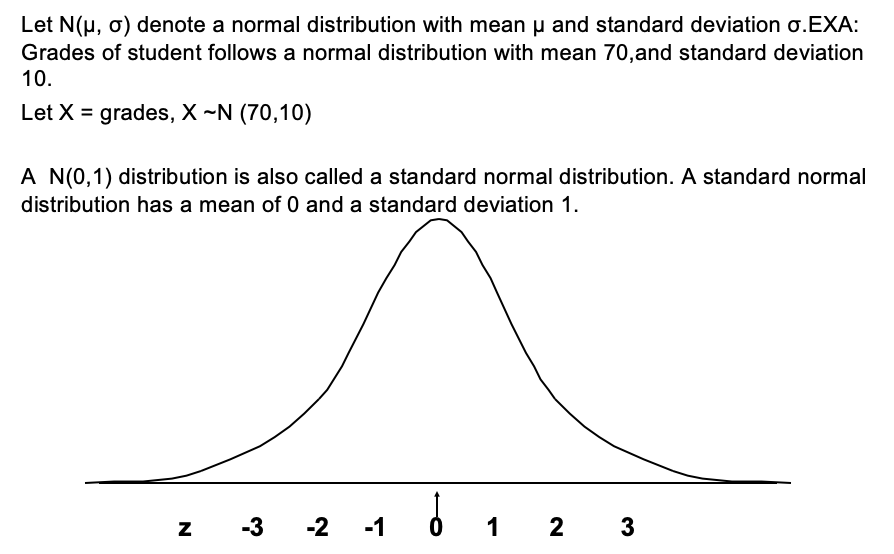
3. Used to determine the value of the normal random variable X to guarantee a given probability or percentage - 5Notation of Normal Distribution
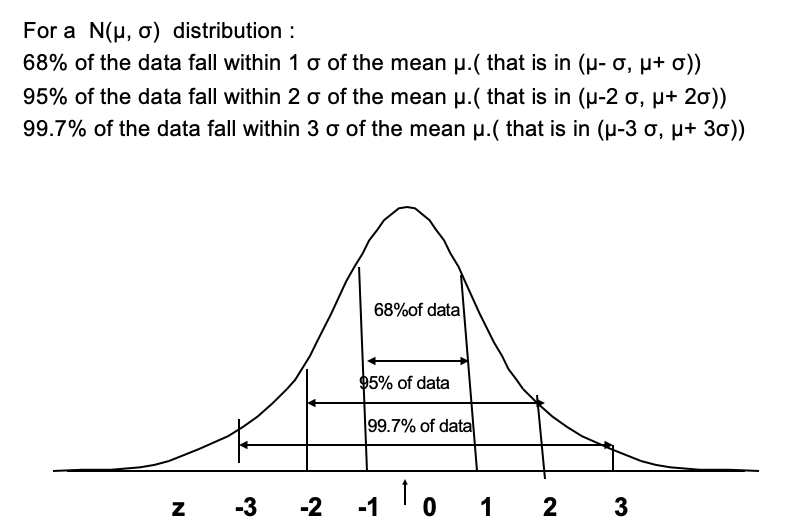
- 6Empirical Rule / 68-95-99.7 Rule
- 7Standard Normal Distribution (Z)Z~N(0,1)
Total Area under standard normal curve = 1
It's probabilities (or proportions or percentages) are tabled - 8Z TableTo use standard normal table to find probabilities...
- read the value of z down the left most column
- then read across the top row
- then find the probability in the body of the table
**Z table can only be used to find probabilities less than or equal to the value of z specified - 9Z- scoreTo find the greater than area under the standard normal curve....
P(Z > z) = 1 - P(Z < z)
To find the probability that Z falls between a and b ....
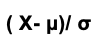
P(a < Z < b) - 10Z-score transformationsZ = (value - mean)/standard deviation
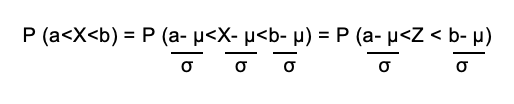
- 11Probability of X in an Interval
- 12Z Score Transformation Example (1)
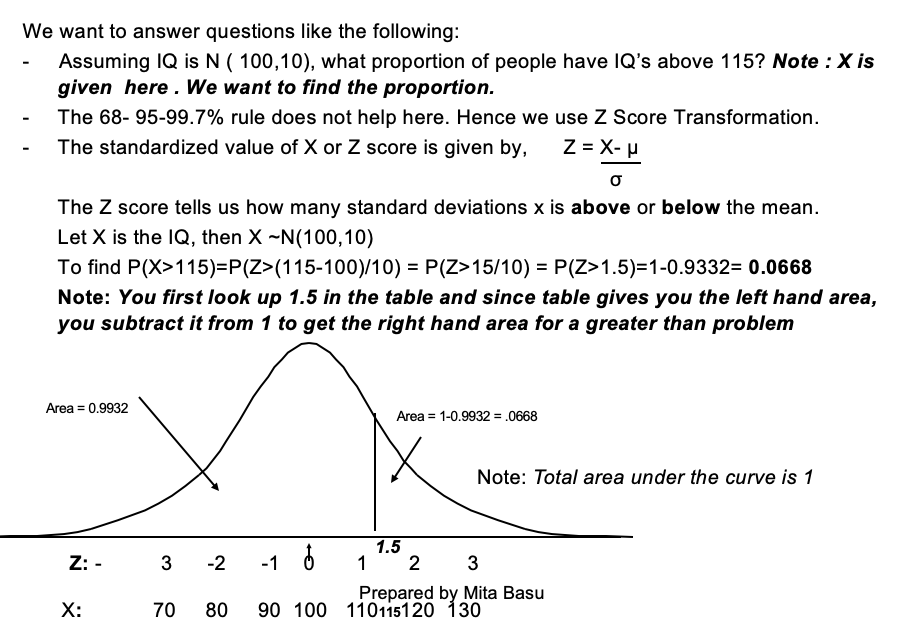
- 13Z Score Transformation Example (2)
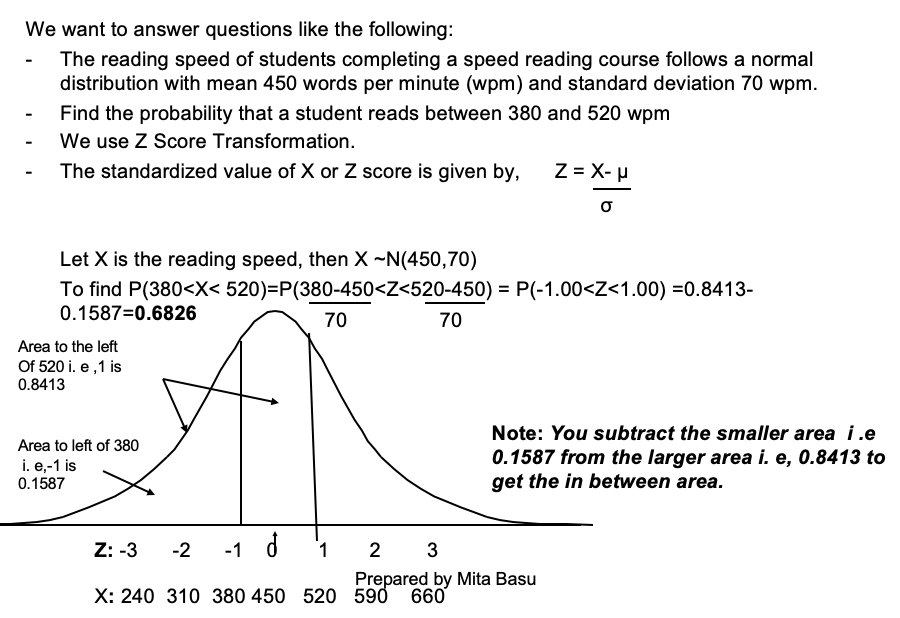
- 14Z Score Transformation Example (3)
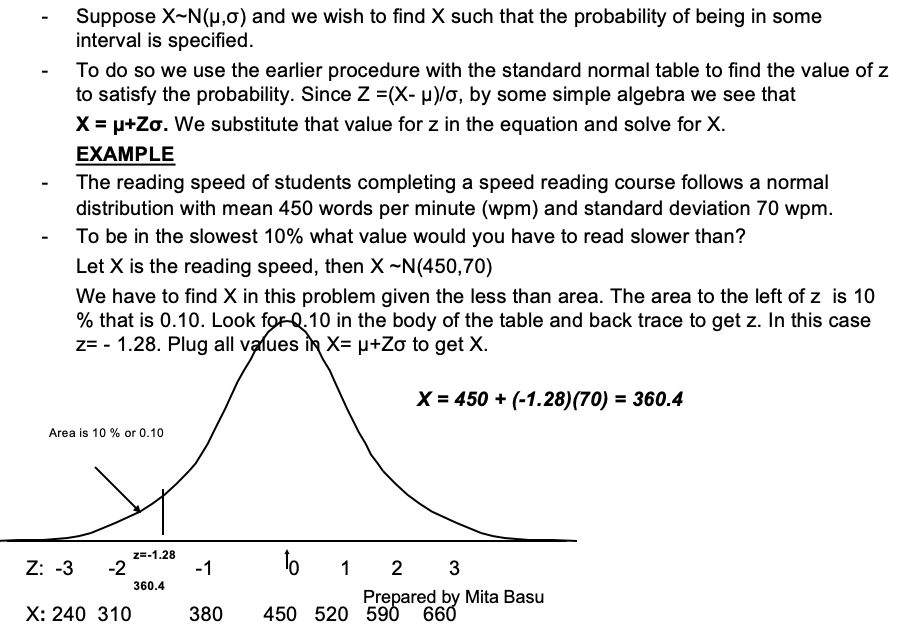
- 15Z Score Transformation Example (4)
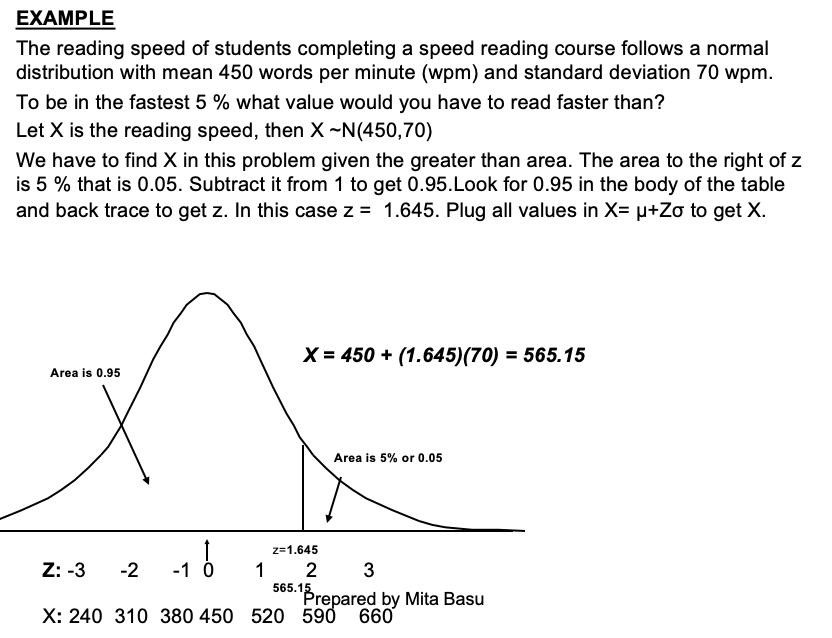
Información
- Descripción
- describing population distributions; normal distributions
- Creado por
- Erin Vales
- Visitas
- 21
- Valoración