32563286
| Pregunta | Respuesta |
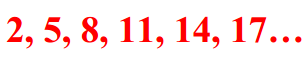
| sequence | an ordered list of numbers |
| term | each number in a sequence |
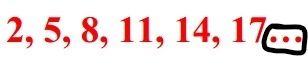
| ellipsis | a set of three periods, which stands for "and so on" |
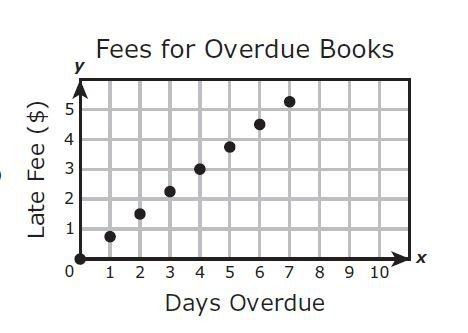
| discrete | a graph made up of isolated points |
| continuous | a graph with no breaks in it |
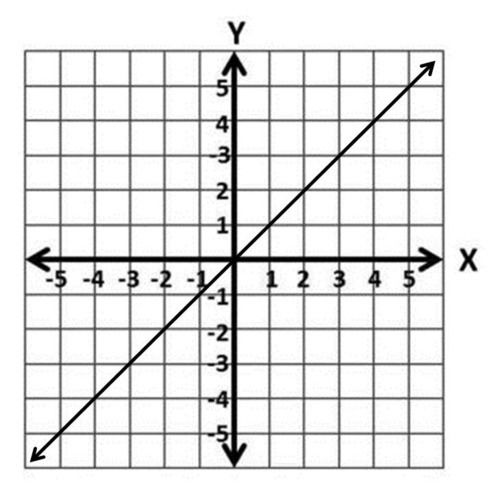
| linear | straight line |
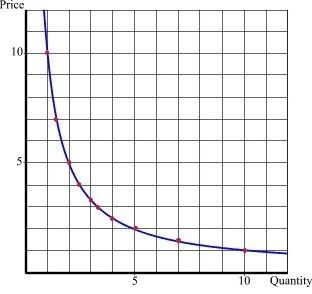
| nonlinear | not a straight line |
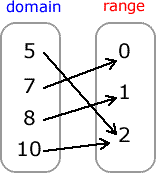
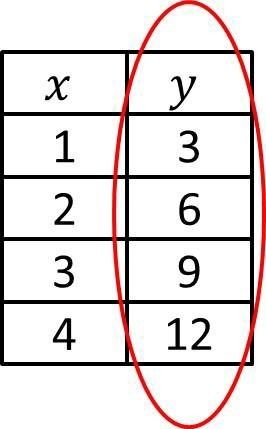
| mapping | Illustrates how each element of the domain (x) is paired with an element in the range (y) |
| set | a collection of numbers, geometric figures, letters, or other objects that have some characteristic in common |
| relation | a set of ordered pairs |
| function | a relation in which each element of the domain is paired with exactly one element of the range |
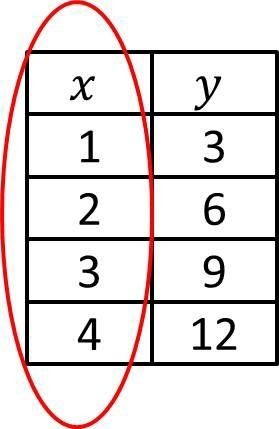
| domain (input) | the set of x-coordinates in a relation. |
| range (output) | the set of y-coordinates in a relation. |
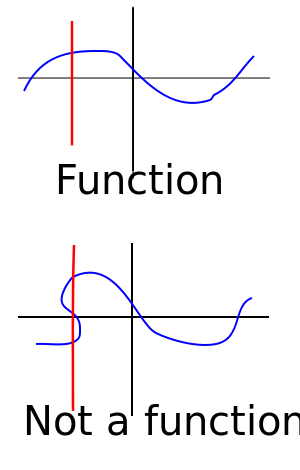
| Vertical Line Test | if any vertical line passes through no more than one point of the graph of a relation, then the relation is a function |
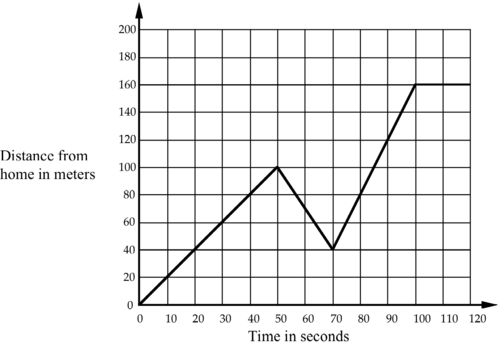
| increasing function | graph (or part of a graph) that rises from left to right |
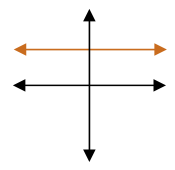
| constant function | graph (or part of a graph) that doesn't increase or decrease; flat line; horizontal |
| decreasing function | graph (or part of a graph) that falls from left to right |
| interval | Can be increasing, decreasing, or constant. In the picture, from 0 to 50 and from 70 to 100 seconds it is increasing. From 50 to 70 seconds, it is decreasing. And from 100 to 120 seconds, it is constant. |
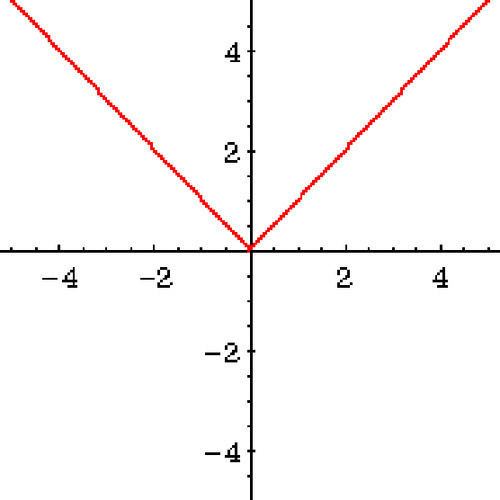
| absolute value function | y = |x|; Graph will be in a "v-shape"; nonlinear |
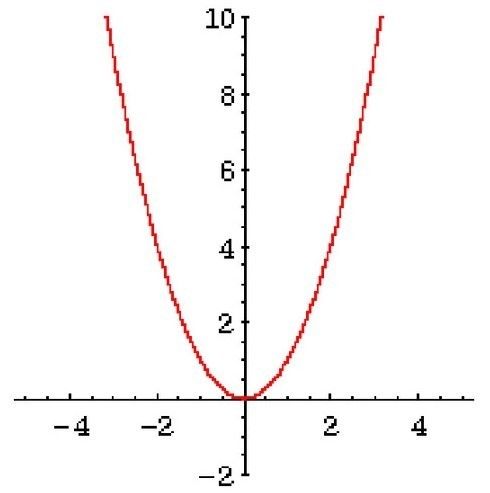
| quadratic function | y=x^2; Graph will be in a "u-shape"; nonlinear |
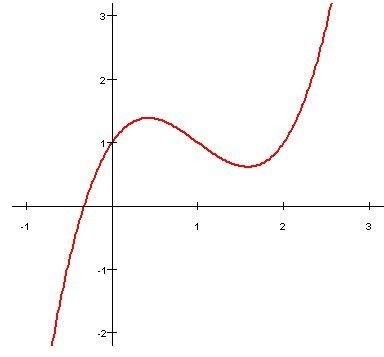
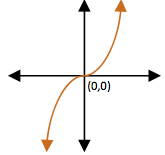
| cubic function | y=x^3; nonlinear |
¿Quieres crear tus propias Fichas gratiscon GoConqr? Más información.