
Diagrama de flujo
selecting a stats test
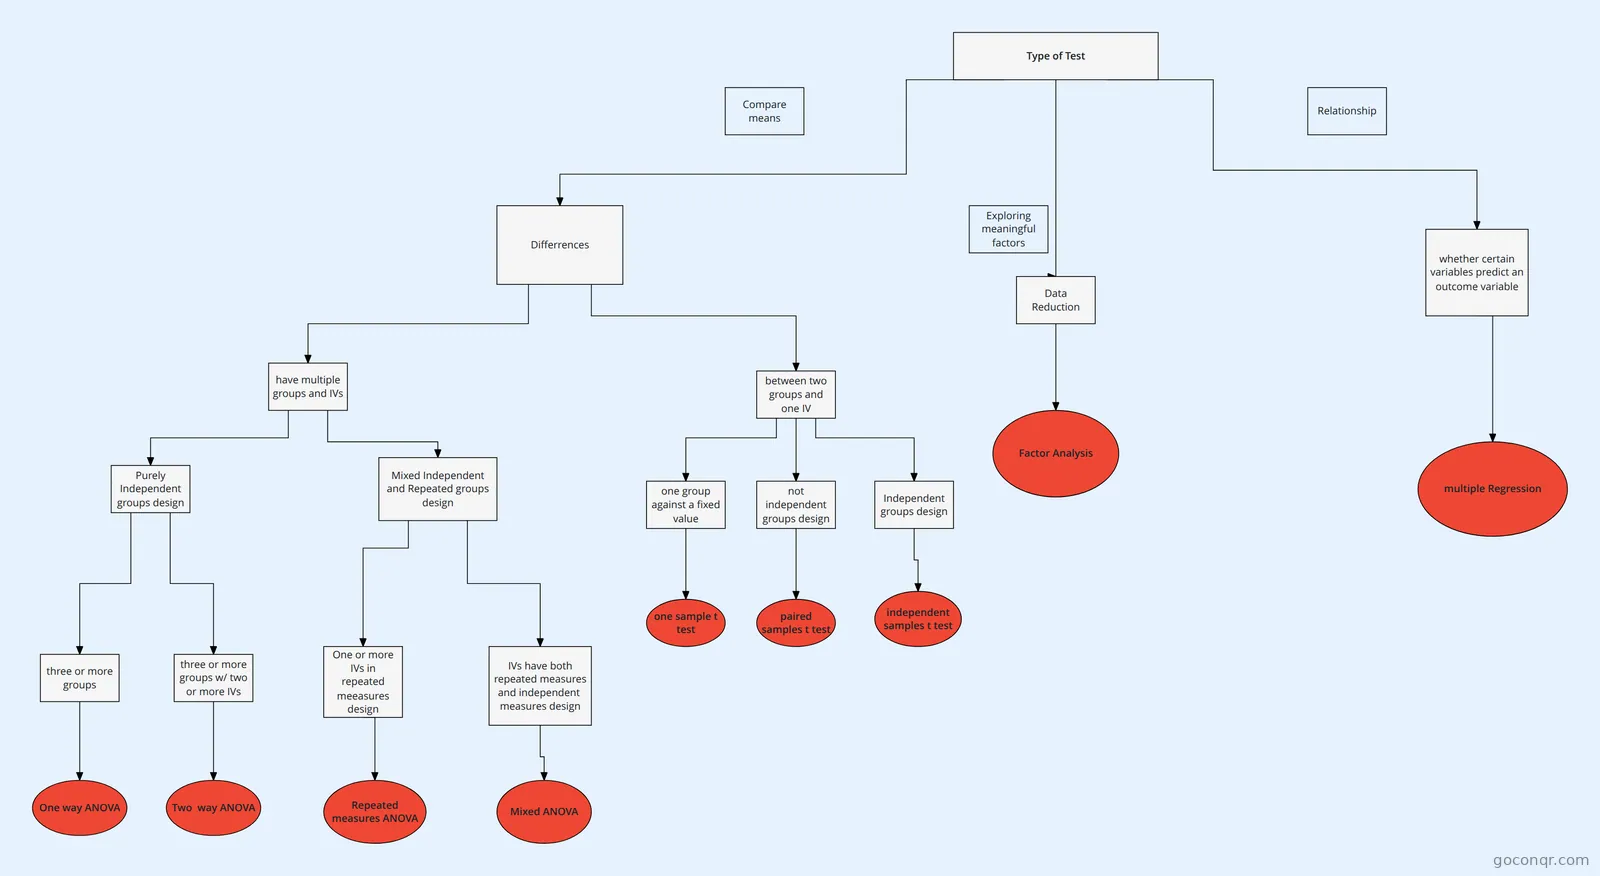
Flowchart: choosing a statistical test flowchart
Contenido del diagrama
Type of Test
Differrences
whether certain variables predict an outcome variable
Compare means
Relationship
Data Reduction
Exploring meaningful factors
Factor Analysis
multiple Regression
between two groups and one IV
one sample t test
Independent groups design
not independent groups design
one group against a fixed value
paired samples t test
independent samples t test
have multiple groups and IVs
Purely Independent groups design
three or more groups
three or more groups w/ two or more IVs
One way ANOVA
Two way ANOVA
Mixed Independent and Repeated groups design
One or more IVs in repeated meeasures design
IVs have both repeated measures and independent measures design
Repeated measures ANOVA
Mixed ANOVA