
Diagrama de flujo
Sin título

Contenido del diagrama
Determine a median interstory drift capacity C for global collapse as the median value of the calculated set of interstory drift capacities, determined for each of the accelerograms. The median value is that value exceeded by 50% of the accelerograms.
Determine a logarithmic standard deviation b for random differences in ground motion accelerograms, using Equation A-10 of Section A.5.2. In this equation, xi is the interstory drift capacity predicted for the i th accelerogram, and n is the number of accelerograms contained in the analyzed suite.
Repeat Steps 2 through 5 for each of the accelerograms in the suite selected as representative of the site and hazard and determine an interstory drift capacity for the structure for each accelerogram.
Repeat Step 4 until the straight line slope between consecutive points Di and Di+1, is less than 0.2 Se. When this condition is reached, Di+1 is the global drift capacity for this accelerogram. If Di+1 > 0.10 then the drift capacity is taken as 0.10. Figure A-1 presents a typical series of plots obtained from such analyses
Choose a suite of ten to twenty accelerograms representative of the site and hazard level for which the Collapse Prevention level is desired to be achieved.
Increase the scaling amplitude of the accelerogram slightly and repeat Step 3. Plot this point as D2. Draw a straight line between points D1 and D2.
Increase the scaling of the accelerogram, such that it will produce mild nonlinear behavior of the building. Perform a nonlinear time-history analysis of the building for this scaled accelerogram. Determine the SaT1 for this scaled accelerogram and the maximum predicted interstory drift from the analysis. Plot this point on the graph. Call this point D1.
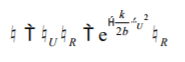
Calculate the global resistance factor due to randomness in the predicted global collapse capacity for various ground motions from the equation:
Where k and b are the parameters described in Section A.5.2 and b is the logarithmic standard deviation calculated in the previous step.
Select one of these accelerograms and perform an elastic time-history analysis of the building. Determine a scaling factor for this accelerogram such that the elastic time history analysis would result in response that would produce incipient yielding in the structure. Determine the 5%-damped, spectral response acceleration SaT1 for this scaled accelerogram at the fundamental period of the structure. On a graph with an abscissa consisting of peak interstory drift and an ordinate axis of SaT1, plot the point consisting of the maximum calculated interstory drift from the scaled analysis and the scaled value of SaT Draw a straight line from the origin of the axes to this point. The slope of this line is referred to as the elastic slope, Se
Incremental Dynamic Analysis
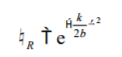
Determine a resistance factor for global collapse from the equation:
Información
- Descripción
- Diagrama sobre Sin título, creado por Marilia Lara el 22/05/2018.
- Creado por
- Marilia Lara · may 2018
- Actualizado
- 22 may 2018
- Visitas
- 0
- Valoración