
Mapa mental
Break Even Analysis
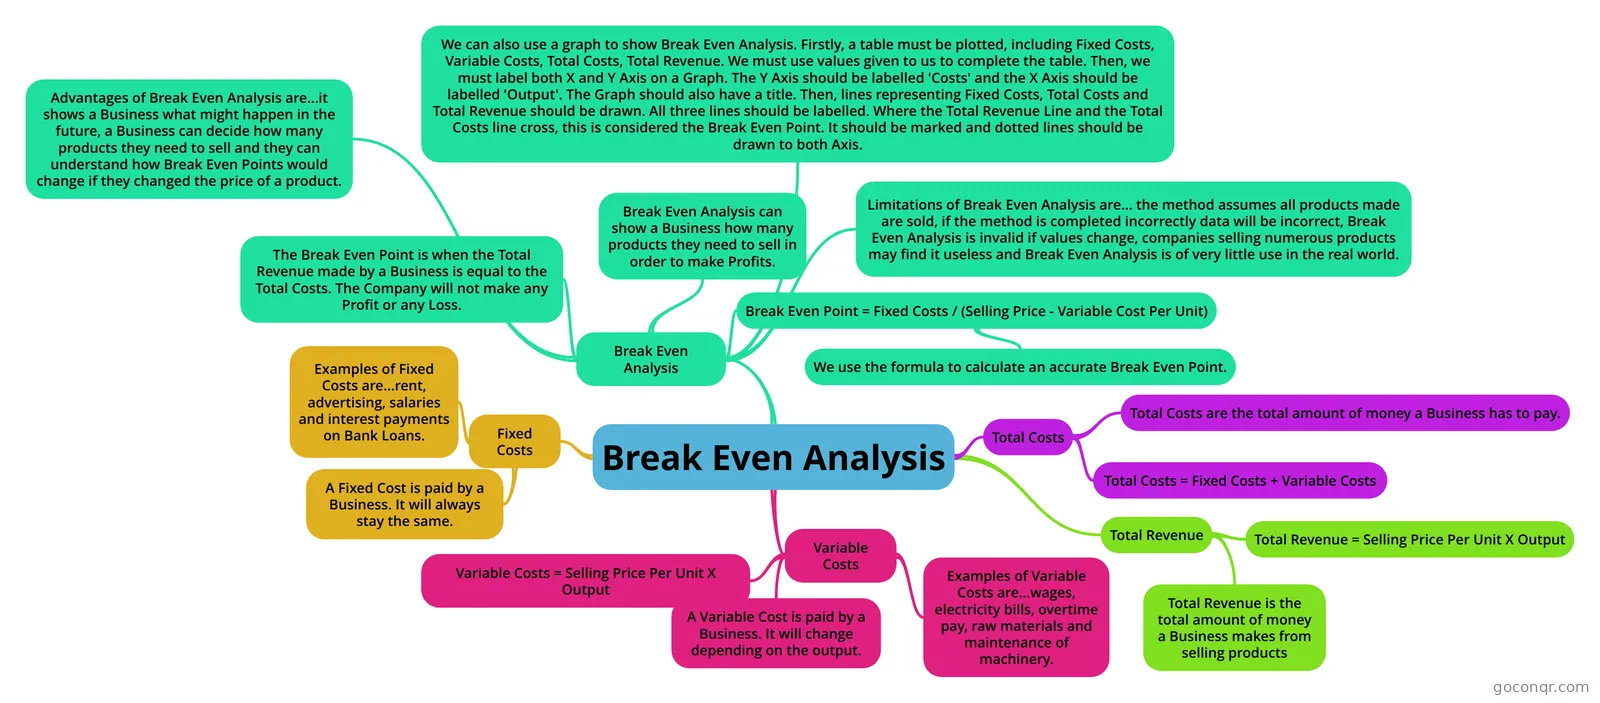
Mind map: break even analysis
Contenido del mapa
Break Even Analysis
Fixed Costs
- A Fixed Cost is paid by a Business. It will always stay the same.
- Examples of Fixed Costs are...rent, advertising, salaries and interest payments on Bank Loans.
Variable Costs
- A Variable Cost is paid by a Business. It will change depending on the output.
- Examples of Variable Costs are...wages, electricity bills, overtime pay, raw materials and maintenance of machinery.
- Variable Costs = Selling Price Per Unit X Output
Break Even Analysis
- The Break Even Point is when the Total Revenue made by a Business is equal to the Total Costs. The Company will not make any Profit or any Loss.
- Break Even Analysis can show a Business how many products they need to sell in order to make Profits.
- Break Even Point = Fixed Costs / (Selling Price - Variable Cost Per Unit)
- We use the formula to calculate an accurate Break Even Point.
- We can also use a graph to show Break Even Analysis. Firstly, a table must be plotted, including Fixed Costs, Variable Costs, Total Costs, Total Revenue. We must use values given to us to complete the table. Then, we must label both X and Y Axis on a Graph. The Y Axis should be labelled 'Costs' and the X Axis should be labelled 'Output'. The Graph should also have a title. Then, lines representing Fixed Costs, Total Costs and Total Revenue should be drawn. All three lines should be labelled. Where the Total Revenue Line and the Total Costs line cross, this is considered the Break Even Point. It should be marked and dotted lines should be drawn to both Axis.
- Limitations of Break Even Analysis are... the method assumes all products made are sold, if the method is completed incorrectly data will be incorrect, Break Even Analysis is invalid if values change, companies selling numerous products may find it useless and Break Even Analysis is of very little use in the real world.
- Advantages of Break Even Analysis are...it shows a Business what might happen in the future, a Business can decide how many products they need to sell and they can understand how Break Even Points would change if they changed the price of a product.
Total Costs
- Total Costs are the total amount of money a Business has to pay.
- Total Costs = Fixed Costs + Variable Costs
Total Revenue
- Total Revenue is the total amount of money a Business makes from selling products
- Total Revenue = Selling Price Per Unit X Output
Información
- Descripción
- Mapa Mental sobre Break Even Analysis, creado por silka el 09/10/2014.
- Creado por
- silka
- Visitas
- 10
- Valoración