
Mapa mental
Flood Hydrographs

Contenido del mapa
Flood Hydrographs
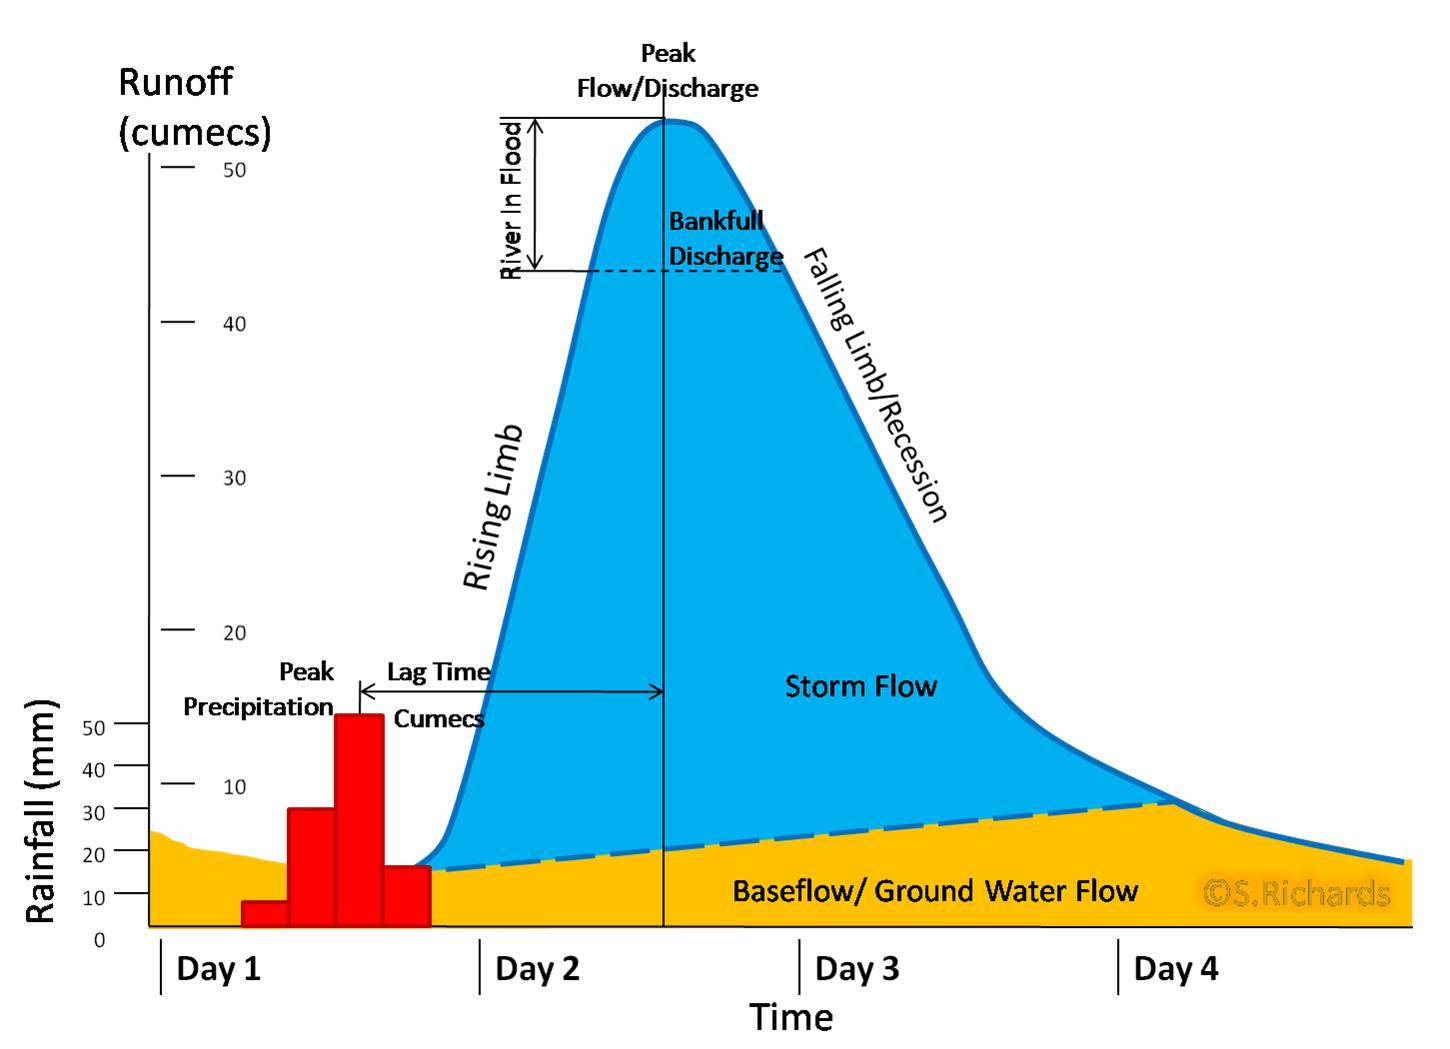
'Flashy' Hydrograph
- Responds quickly to rainfall
- Steep rising and falling limbs
- High peak discharge
- Recorded over a 26 hour period
- Short lag time
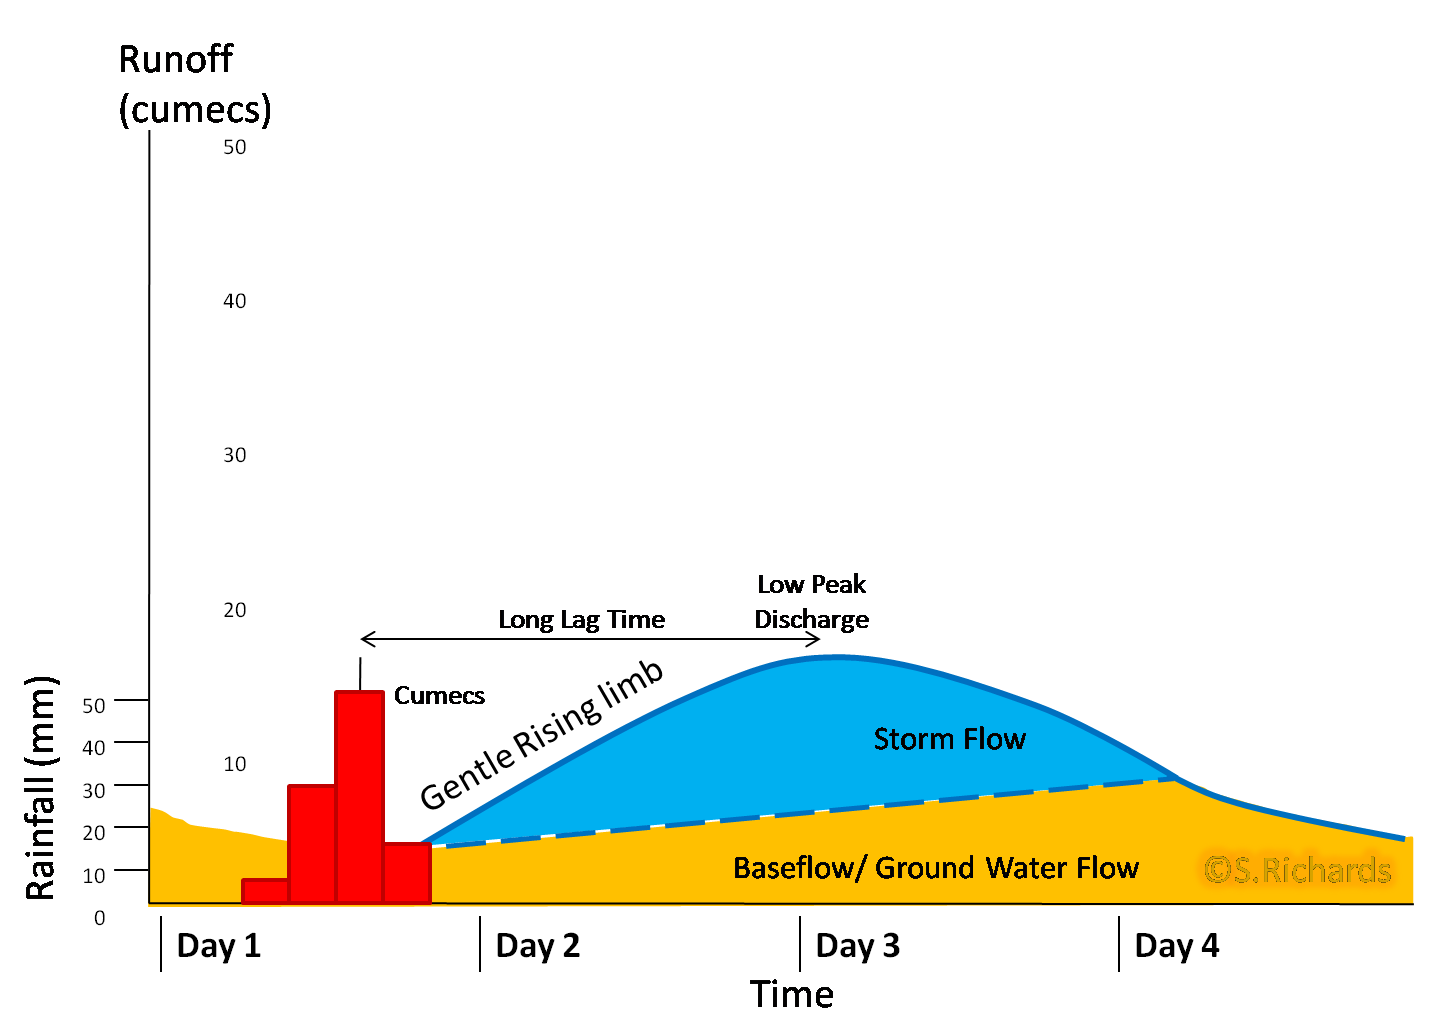
'Non-Flashy' Hydrograph
- Responds slowly to rainfall
- Gentle rising and falling limbs
- Low peak discharge
- Recorded over a 4 day period
- Long lag time
Keywords
- Falling Limb - The period of time when the rivers discharge is falling
- Rising Limb - The period of rising river discharge following a period of rainfall
- Peak Discharge - The time of maximum discharge by the river
- Normal Flow - The base flow of a river
- Peak rainfall - the hour of greatest rainfall during a storm
- Lag Time - The period of time between peak rainfall and peak discharge
Imágenes y archivos del mapa
Información
- Descripción
- A level Geography - Physical Mind Map on Flood Hydrographs, created by Liam Cooney on 24/04/2017.
- Creado por
- L C
- Visitas
- 144
- Valoración