
Apuntes
Break-even Analysis - created from Mind Map
Contenido del apunte (1)
Página 1
Nature Costs
Calculations of break even
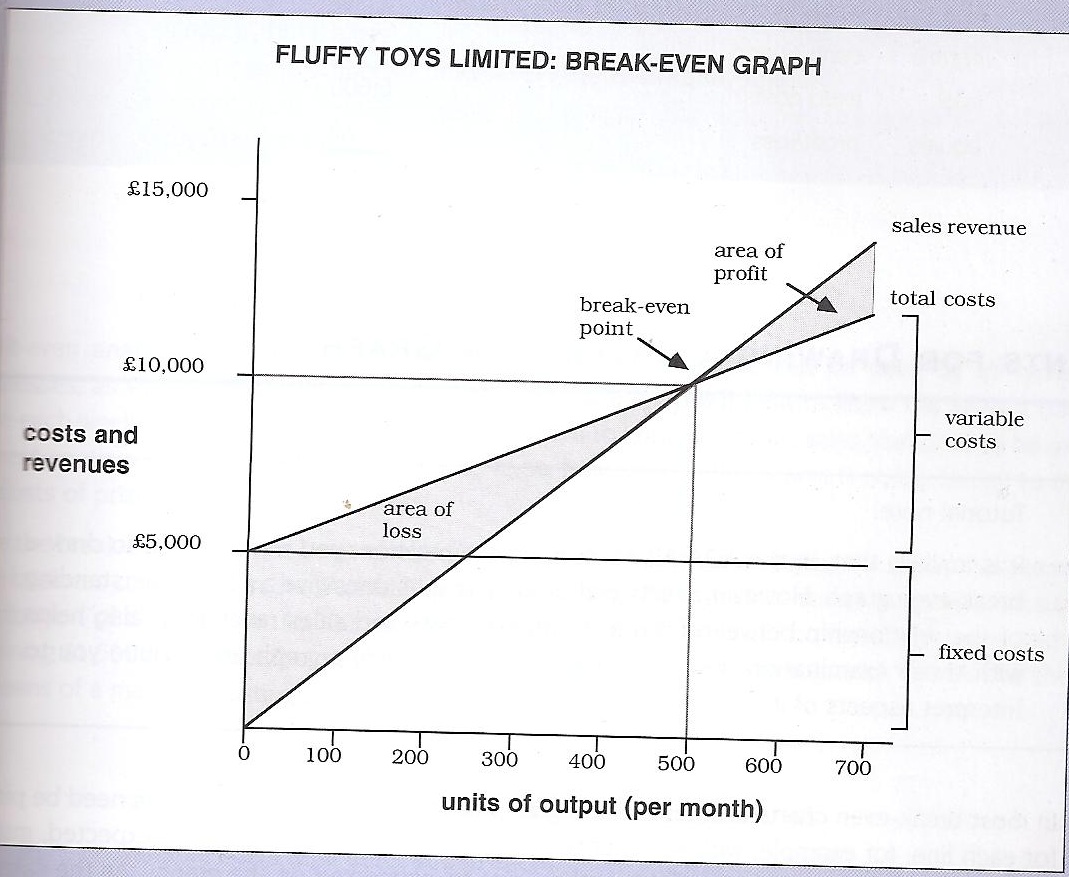
Interpretation of break-even
Margin of Safety
Target Profit
Contribution sales/Profit Volume ratio
Dis-advantages/ Limitations
Advantages
When to use Break-even analysis?
Fixed Costs
Semi- variable
Variable
Formula
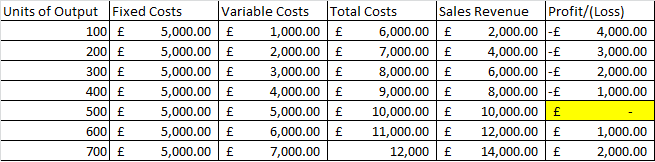
Table Method
Graph Method
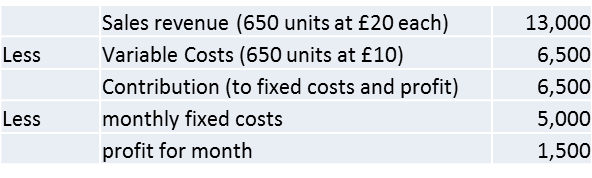
Selling Price (Per Unit) - Variable Costs (Per Unit) = Contribution per Unit
Fixed Costs / Contribution per Unit = Break-even point
The information provided can help interpret what the profit would be after selling a certain amount of units.
The amount by which sales exceed the break-even point.
No. of units : Sales volume - break-even point (units)
Sales Revenue amount : Sales volume - break-even point (units) x Selling price
Percentage : (current output - break-even output) (100) / Current output
Calculating the 'Target Profit' shows the amount of output that needs to be sold in order to give a certain amount of profit
(fixed costs + target profit) / Contribution per unit
Expresses the amount of contribution in relation to the amount of the selling price
Formula
Calculated on the basis of a single unit of production or for the whole business
If Fixed costs are known, we can use the CS ratio to find the sales value at which the business breaks-even, or the sales value to give a target amount of profit
Contribution / Selling Price
Based on estimates
No semi-variables
External factors not considered, such as economy, interest rates, the rate of inflation, etc
Relationship between sales revenue, variable costs and fixed costs remains the same at all levels of production. Only useful if the product is going sell in sufficient quantities
Difficult to make calculations for a mix of products, therefore it require separate calculations for every different type of product
costs and revenue are expressed in terms of straight lines, however the relationship is not always so. Selling prices vary at different quantities sold; in similar way, variable costs alter at different levels as advantage is taken of the lower prices to be gained from bulk buying, and/or more efficient production methods
Fixed costs do not remain fixed at all levels of output
You can not forecast from the graph of what could be obtained by selling more units, therefore not allowing you to extrapolate the graph or calculations
The profit or loss shown by the graph or calculations is probably only true for figures close to current output levels - the more that output changes from the current figures, the less accurate will be the expected profit or loss
Useful for a new business in order establish the level of sales that must be achieved to reach break-even point.
Before starting a new business
When making changes within a business
To measure profits and losses
To answer 'what if?' questions
To evaluate alternative viewpoints
The calculation of break-even point is important in order to see the level of sales needed by the business in order to cover costs, or to make particular levels of profit. The feasibility of achieving the level can be considered by the owner of the business, and other parties such as the bank manager.
The cost of a major change will need to be considered by the owners and/or managers. Eg. a large increase in production will. most likely, affect the balance between fixed and variable costs. Break-even analysis will be used as part of the planning process to ensure that the business remains profitable.
Within the limitations of break-even analysis, profits and losses can be estimated at different levels of output from current production. (Remember that this can be done only where the new output is close to current levels and where there is no major change to the structure of costs - ie. it is not possible to extrapolate)
Questions such as 'what if sales fall by 10%?' and 'what if fixed costs increase by £1,000?' can be answered - in part at least - by break-even analysis. The effect on the profitability of the business can be seen, subject to the limitations. A question such as 'what if sales increase by 300 per cent?' is a fundamental change that it can only be answered by exclaiming the effect on the nature of the fixed and variable costs and then re-calculating the break-even point.
There are often different ways of production; this is particularly true of a manufacturing business. For example, a product could be made, either by a labour-intense process, with a large number of employees supported by basic machinery, or buy using expensive machinery in an automated process with very few employees. In the first case, the cost structure will be high variable costs (labour) and low fixed costs (depreciation of machinery). In the second, there will be low variable costs and high fixed costs. Break-even analysis can be used to examine the relationship between the costs which are likely to show a low break-even point in the first case, and a high break-even point in the second. In this way, the management of the business is a guided by break-even analysis; management will also need to know the likely sales figures, and the availability of money with which to buy the machinery.
Información
- Descripción
- Business/Economics Apunte sobre Break-even Analysis - created from Mind Map, creado por Azlaan Zubair el 08/12/2019.
- Creado por
- Azlaan Zubair
- Visitas
- 1
- Historial
-
- Creado por Harshad Karia · 8 dic 2019
- Copiado por Azlaan Zubair · 8 dic 2019
- Copiado a Apunte por Azlaan Zubair · 8 dic 2019
- Valoración