
Fichas
Bioinformatik R3
Fichas del conjunto (12)
- 1What is the Null hypothesis (H0)?The null hypothesis tests for NO DIFFERENCE between the groups.
If we test each group with a lot more data then there is a lower probability that
the differences are due to chance.
f.e.: There is no difference between the recovery time of patients taking drug A or B.
We can reject or Fail to reject the 0 Hypothesis - 2What is the alternative hypothesis (HA)?The alternative hypothesis tests for DIFFERENCE between the groups.
f.e.: HA = There is a difference between the recovery time of patients taking drug A or B. - 3What is the hypothesis-testing protokoll?1. collect Data + form a hypothesis (Ho, HA)
2. Statistical test (with a certain P-Value)
3. Decision to reject or fail to reject the null hypothesis - 4What is the P-Value?A P-value represents the probability of our result assuming the NULL hypothesis is true
(Area under the graph)
high-> H0 is right
low-> HA is right
commonly accepted P-Value is 0.05 or 5% - 5What is the difference between a Parametric and a non-Parametric test?parametric test-> data comes from a normal distribution (t-test)
non-parametric test-> data isn’t normally distributed or it cannot be approximated by a normal distribution (Wilcoxon) - 6What can be assumed of the t-test?A t-test assumes the two samples come from the same population
And calculates the probability of the observed difference in means
The P-value is simply the shaded area below the t-
distribution to the left of -ts and the right of ts.
You can always look up the values of the ts in tables
and the corresponding P-value. - 7What can you test with a Shapiro-WIlk test?tells us if our data could come from a Normal
distribution or not.
• The test statistic is W.
• If the P-value associated with W is lower than 0.05 then our data is most likely
NOT normal. - 8What can be said about the Wilcoxon test?Samples need to be independent
• Advantage: Since the test is based on ranks it is not affected by outliers.
Data doesnt have to be normally distributed
• Disadvantage: Less powerful than a parametric test. - 9How to you go about the Wilcoxon test?To calculate it, we first order the data from lowest to highest for both groups.
• Then, for each value, we count the number values of the other group that are smaller.
• We then sum each new column and obtain a K1 for group 1 and K2 for group 2.
The test statistic Us is defined by the largest K.
resulting p-value tells us if Ho or H1 is plausable - 10What can be said about the Chi-squared test?Data is categorical
(imagine we sample many individuals
from a population and store genotype information.
This information isn’t numerical.)
Compare the observed #genotypes with the expected #genotypes. - 11What is the Chi-squared test protokoll?1. convert raw data to a count table
2. compare observed vs. expected frequencies
in categorical data.
For each category (AA,AB): (observed-expected^2/ expected)
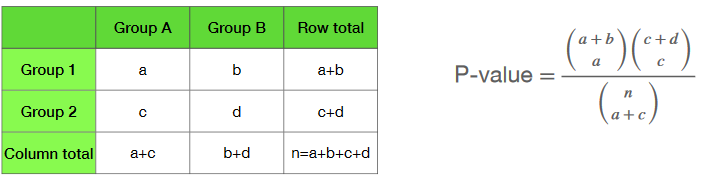
3. compare the test statistics (x^2) to the 5% significance - 12what can be said about the Fishers exact test?- This test is an alternative to the chi-squared test.
• It works only for 2x2 contingency tables
• It can also be used when dealing with small samples.
• In genetics, it is particularly useful to quantify the overlap between two sets of genes.
Información
- Descripción
- El usuario ha eliminado su información de asignaturas Fichas sobre Bioinformatik R3, creado por Usuario eliminado el 17/09/2024.
- Creado por
- Usuario eliminado · sep 2024
- Actualizado
- 17 sep 2024
- Visitas
- 7
- Historial
-
- Creado por Alicia L · 14 sep 2024
- Copiado por Alicia L · 17 sep 2024
- Valoración