
Apuntes
Gantt Charts
Contenido del apunte (4)
Página 1
Introduction to Gantt Charts
Gantt charts are one of the most popular and useful ways of showing activities displayed against time.
The position and length of a bar in a Gantt chart reflects the start date, duration and end date of a particular activity.
Gantt charts allow the following to be seen at a glance:
What activities are involved in a project
When each activity will begin and end
How long each activity will last for
Where activities overlap in time and for how long
Start and end of overall project
Additional information that can be shown in a Gantt chart:
How tasks relate to each other
Current status of each task
Resources required for each task
Who a task has been assigned to
Página 2
Gantt chart examples
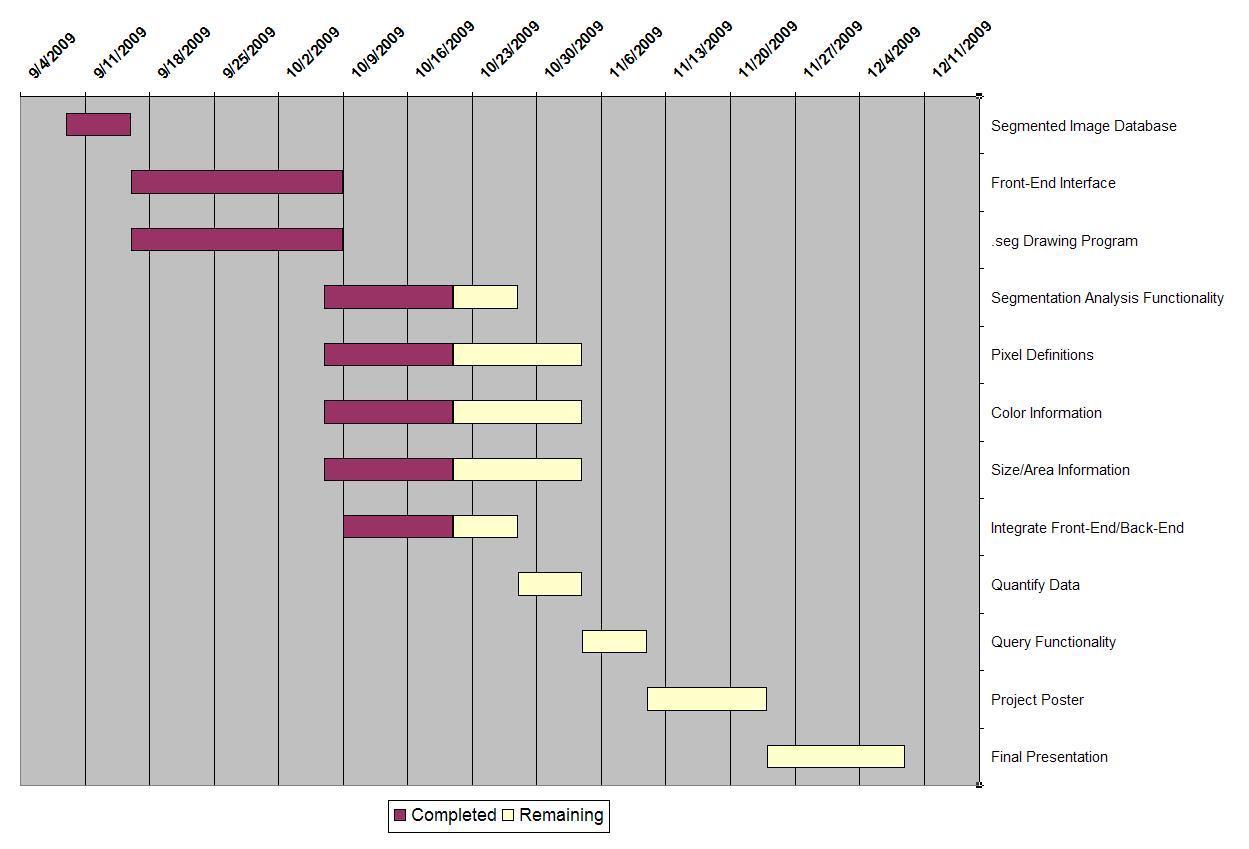
The following simple Gantt chart shows the progression of a project to design a computer program over a seven month period.
Página 3
Gantt Chart Examples
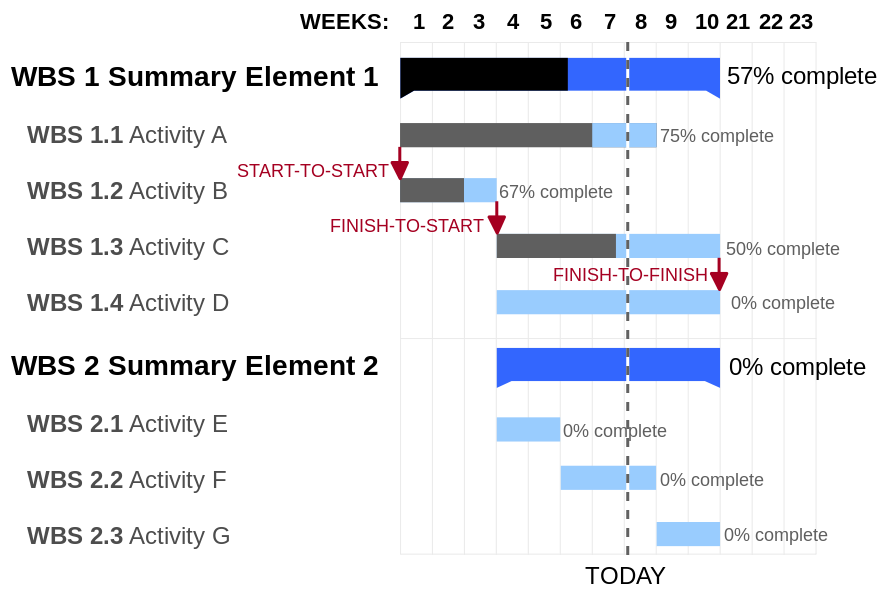
This more advanced Gantt chart shows the progression of tasks and how they relate to each other.
The dashed line represents today, allowing the user to compare expected progress to actual progress.
Página 4
Making Gantt Charts
There are a number of ways to make a Gantt Chart:
Download a Gantt chart template from the Microsoft website for use in Powerpoint or Excel
Download software designed especially for making Gantt charts
Use an online interface to design your Gantt chart
When scheduling activities:
Schedule them in such a way that sequential actions are carried out in the required sequence.
Ensure that dependent activities do not start until the activities they depend on have been completed.
Where possible, schedule parallel tasks so that they do not interfere with sequential actions on the critical path. While scheduling, ensure that you make best use of the resources you have available, and do not over-commit resources.
Allow some slack time in the schedule for holdups, overruns, failures, etc.
Información
- Descripción
- El usuario ha eliminado su información de asignaturas Apunte sobre Gantt Charts, creado por Usuario eliminado el 27/07/2017.
- Creado por
- Usuario eliminado · jul 2017
- Actualizado
- 27 jul 2017
- Visitas
- 140
- Historial
-
- Creado por Niamh Ryan · 25 jul 2017
- Copiado por Niamh Ryan · 27 jul 2017
- Valoración