
Test
Statistics Chapter 1-3
Crea una cuenta gratis para terminar este test
Guarda tu progreso y consulta tu resultado final.
¿Ya tienes cuenta? Inicia sesión
Preguntas del test (10)
1In a study of commuting patterns of people in a large metropolitan area, respondents were asked to report the time they took to travel to their work on a specific day of the week. What is the individual?
- ATravel time
- BA person
- CDay of the week
- DCity in which they lived
2If we asked people to report their "weight", would that variable be considered a categorical or quantitative variable?
- ACategorical
- BQuantitative
3We asked people whether their weight is underweight, normal, overweight, or obese. Is this variable categorical or quantitative?
- ACategorical
- BQuantitative
4A survey involving 35 questions was given to a sample of 200 students attending a university with an enrollment of 10,000. How many individuals does the database describe?
- A35
- B200
- C10,000
- DImpossible to say
5A survey involving 35 questions was given to a sample of 200 students attending a university with an enrollment of 10,000. How many variables does the data contain?
- A35
- B200
- C35 x 200
- D35 x 10,000
6What type of data is produced by the answer choices for this question?
How many times have you accessed the internet this week?
1. Never
2. Once or Twice
3. Three or Four times
4. More than Four times- ACategorical
- BQuantitive
7For data involving answers to the following question, what is the BEST method of displaying the data?
How many times have you accessed the internet this week?
1. Never
2. Once or Twice
3. Three or Four times
4. More than Four times- ABar Graph
- BBoxplot
- CHistogram
- DScatterplot
8The purpose of pie charts and bar charts is to ________.
- AHide the data from the audience
- BImpress the audience with interesting colors and shapes
- CHelp the audience grasp the distribution of data quickly.
- DDisplay the distribution of quantitive variables
9Married respondents in a survey were asked how they met their spouse. According to the bar chart below, how many respondents met their spouse through a dating service?
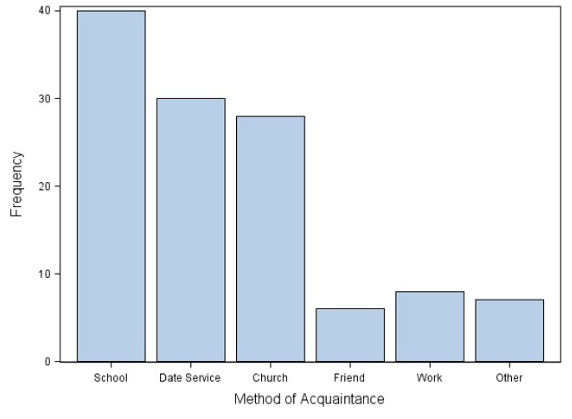
- A2
- B20
- C30
- D70
10Look at the following histogram of salaries of baseball players. What shaped would you say the data take?
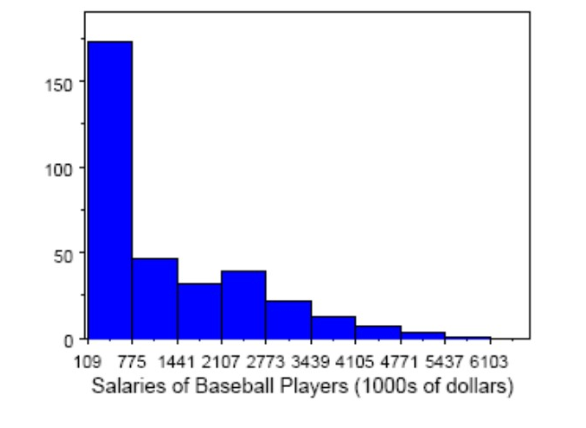
- ABi-modal
- BLeft-skewed
- CRight-skewed
- DSymmetric
Información
- Descripción
- Test sobre Statistics Chapter 1-3, creado por Zoe CC el 09/05/2019.
- Autor
- Zoe CC
- Idioma
- English
- Visitas
- 0
- Valoración
- Aún sin valoraciones Valora este test