
Test
Microsoft Excel Pretest
Este test tiene tiempo límite, así que se abre en el reproductor de siempre.
Preguntas del test (5)
1What is the purpose of a pivot table?
- ATo compare data from different workbooks.
- BTo merge different scenarios.
- CTo summarize data in a three dimensional table.
- DTo highlight formula errors.
- ETo perform a what-if analysis on a data table.
2If I fill out the PivotTable Field list as below to create a pivot table, what will be the result? SalesPerson then Region to Row Field, Sales to Value Field, Month to Report Filter (Accept Default Options)
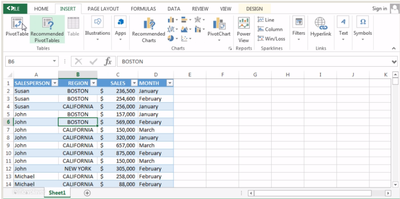
- A
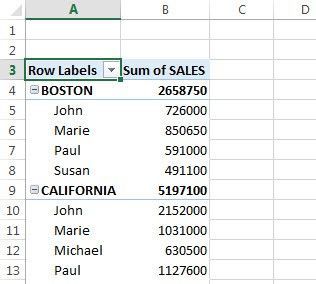
- B
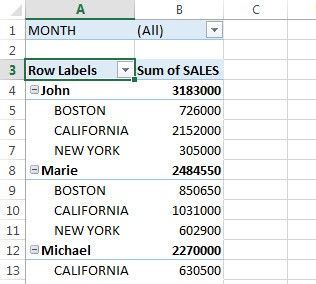
- C
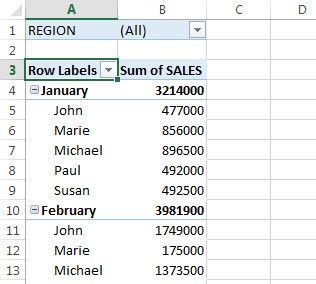
- A
3In this column chart, the columns are represented by images. What method can be used to insert images in place of traditional columns in such a chart?
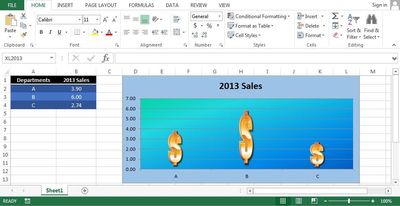
- AI cannot do this with Excel, but I can import my chart into PowerPoint, edit it, and reinsert it into Excel.
- BThis is not really a chart, but an image composed of shapes and drawings.
- CI copy an image to the clipboard, select the columns of the chart by clicking on them, and then paste the image.
- DI select the chart, then select a chart type from the Chart Styles gallery .
4I entered a date in cell B4 that I wish to replace with the value 10.5 (to be used in calculations) and have it display as “10.5” (without the quotes).
How can I do this?- AI can only enter a date in cell B4, not any other type of value.
- BFirst I should delete the date with the DELETE key.
- CI should change the number formatting of the cell.
- DI should type a space before entering the value 10.5.
- EI simply enter 10.5 in the cell and the value will display correctly.
5Which chart type is best for comparing the product quality test scores?
- AA doughnut chart
- BA radar chart
- CA bar chart
- DA line chart
Información
- Descripción
- To assess Excel Skills
- Autor
- Ranitha Jeyasing
- Idioma
- English
- Visitas
- 878
- Etiquetas
- Valoración
- Aún sin valoraciones Valora este test