
Test
UPRA The 7 New Management and Planning Tools
Este test tiene tipos de pregunta que se abren en el reproductor de siempre.
Preguntas del test (22)
1In 1976, the JUSE saw the need tor tools to promote innovation, communicate information and successfully plan major projects.
- AVerdadero
- BFalso
2The new 7 tools replaced the 7 basic quality tools.
- AVerdadero
- BFalso
3The new 7 tools were developed to organize [blank_start]verbal[blank_end] data [blank_start]diagrammatically[blank_end].
The basic 7 tools are effective for data analysis, process control, and quality improvement ([blank_start]numerical[blank_end] data).- Averbal
- Bhypothetical
- Cnumerical
- Ddiagrammatically
- Ein text
- Fwith images
4These tools are part of the seven basic:
- APDPC
- BPareto chart
- CScatter diagrams
- DTree diagram
5The cause and effect diagram is also known as:
- AHistogram
- BFish bone diagram
- CFlowchart
6This image is an example used in:
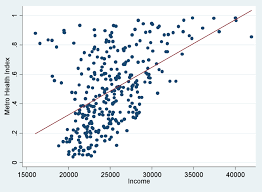
- ACheck sheet
- BPareto chart
- CScatter diagram
7Which is the name of the tool represented by this image?
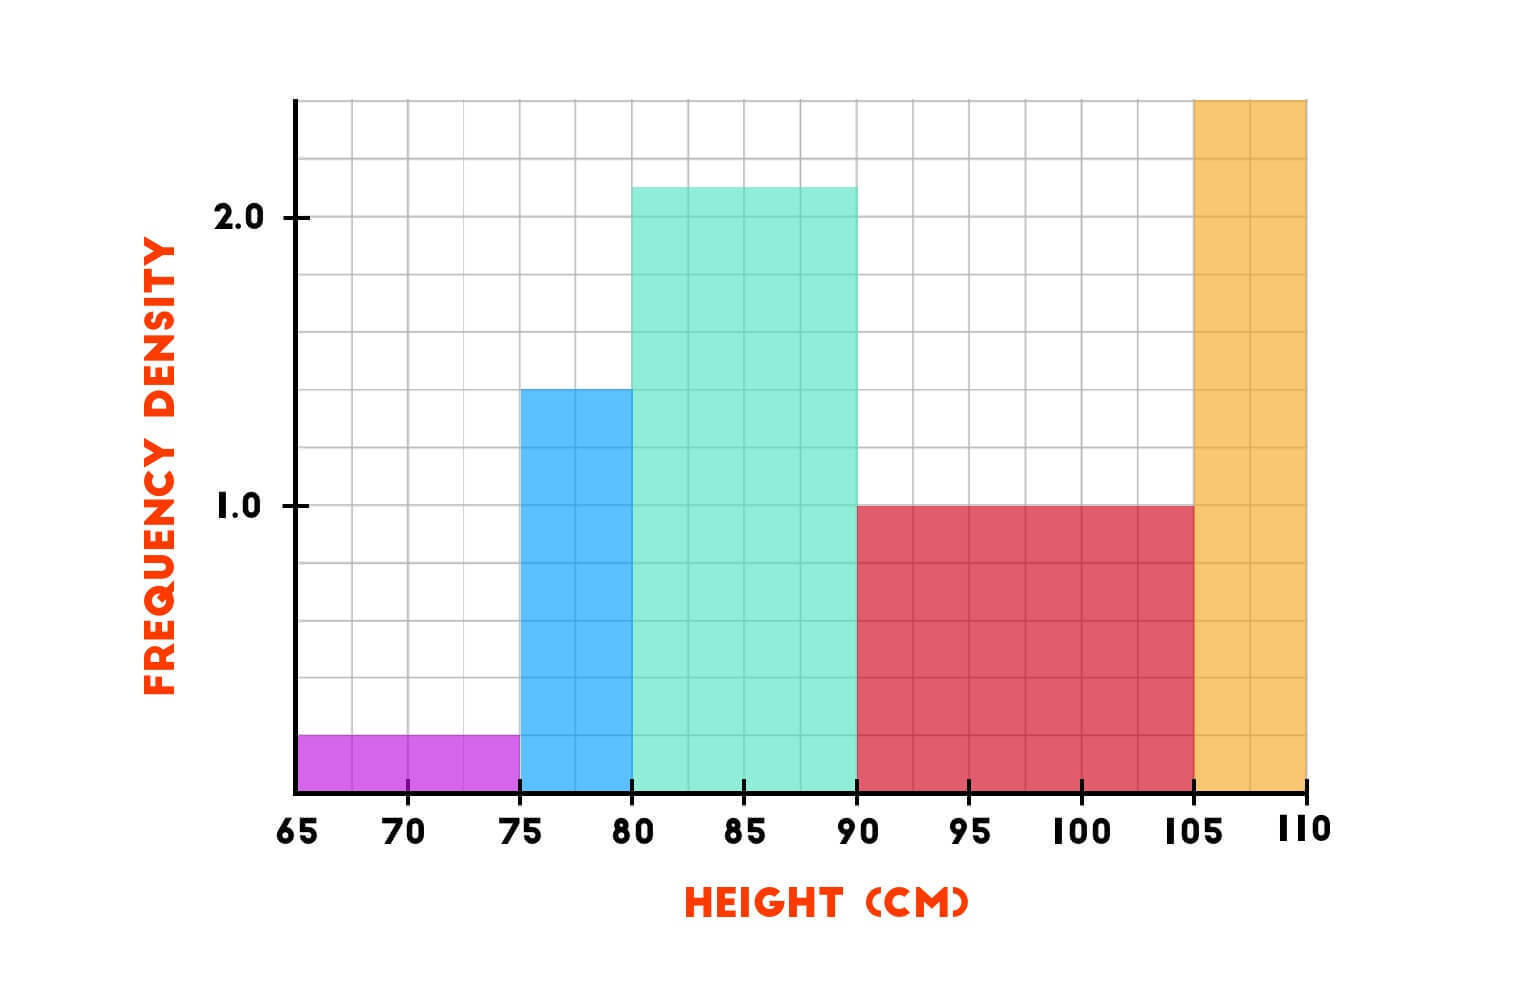
- ACause and effect diagram
- BHistogram
- CIshikawa diagram
8The basic seven tools:
-Define problem [blank_start]after[blank_end] collecting numerical data.
-[blank_start]Analytical[blank_end] approach.
The new seven tools:
-Define problem [blank_start]before[blank_end] collecting [blank_start]numerical[blank_end] data.
-Generate ideas, [blank_start]formulate[blank_end] plans.- Aafter
- Bbefore
- CAnalytical
- Dformulate
- Enumerical
9Gathers large amounts of verbal data; then organizes the data into groups based on natural relationship.
- ATree diagram
- BAffinity diagram
- CPDPC
10Allow a team to systematically identify, analyze and classify the cause and effect relationships that are not easily recognizable and exist among all critical issues.
- AMatrix Diagram
- BPareto Chart
- CRelations Diagram
11The arrow diagram is also known as systematic diagram?
- AVerdadero
- BFalso
12The tree diagram is also known as or dendrogram?
- AVerdadero
- BFalso
13When do we use matrix diagram?
- AWhen we need to evaluate quantitatively.
- BWhen the price of failure is high.
- CWhen we want to summarize customers requirements and compare them to the characteristics to achieve them.
- DWhen we want to relate to groups (or more) of ítems to each other to give information about the relationship.
- EAfter a brainstorming exercise.
14We use arrows diagram for working out optimal schedules and controlling them effectively.
- AVerdadero
- BFalso
15In the latest 3 years, people stopped using nodes for the arrows diagram.
- AVerdadero
- BFalso
16¿What is the meaning of PDPC?
[blank_start]Process Decision Program Chart[blank_end]- AProcess Decision Program Chart
17Identifies what might go wrong in a plan under development. Countermeasures are developed to prevent those problems.
- ATree diagram
- BRelations diagram
- CHistograms
- DPDPC
18These "steps" are part of PDPC:
- ACountermeasure
- BRelations
- CPlan
- DCategories
- EProblems
19List the 7 new tools:
[blank_start]Affinity Diagram[blank_end][blank_start]Relations Diagram[blank_end]
[blank_start]Tree Diagram[blank_end]
[blank_start]Matrix Diagram[blank_end]
[blank_start]Arrows Diagram[blank_end]
[blank_start]PDPC[blank_end]
[blank_start]Prioritization Matrix[blank_end]- AAffinity Diagram
- BFlow chart
- CRelations Diagram
- DCheck sheet
- ETree Diagram
- FCause and effect diagram
- GMatrix Diagram
- HPareto chart
- IArrows Diagram
- JControl charts
- KPDPC
- LHistograms
- MPrioritization Matrix
- NScatter diagrams
20List the 7 basic quality tools:
[blank_start]Flowchart[blank_end].
[blank_start]Check Sheet.[blank_end] [blank_start]Cause and Effect (fish bone) Diagram.[blank_end]
[blank_start]Pareto Chart.[blank_end]
[blank_start]Control Charts.[blank_end]
[blank_start]Histograms.[blank_end]
[blank_start]Scatter Diagrams.[blank_end]- AFlowchart
- BAffinity diagram
- CCheck Sheet.
- DRelations diagram
- ECause and Effect (fish bone) Diagram.
- FTree diagram
- GPareto Chart.
- HMatrix diagram
- IControl Charts.
- JArrows diagram
- KHistograms.
- LPDPC
- MScatter Diagrams.
- NPrioritization matrix
21Benefits of New 7 quality tools:
- AProvide training in thinking.
- BExpress verbal data diagrammatically.
- CRaise people's problem solving confidence.
- DMake information visible.
- EGet more people involved.
- FIncrease people's ability to predict future events.
22The tool that you can see in the image refers to:
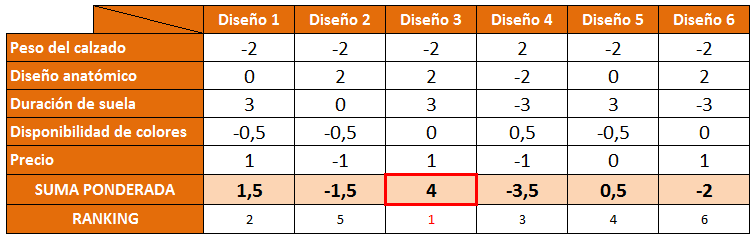
- AMatrix Diagram
- BPrioritization Matrix
- CC Matrix
Información
- Descripción
- herramientas de mejora Test sobre UPRA The 7 New Management and Planning Tools, creado por Lourdes Torralba el 25/03/2019.
- Autor
- Lourdes Torralba
- Idioma
- Español
- Visitas
- 135
- Etiquetas
- Valoración
- 5,0 de 5 · 1 valoración Valora este test