
Test
Pie charts
Preguntas del test (4)
1What is a pie chart?
- Aa type of graph in which a circle is divided into sectors that each represent a proportion of the whole.
- BA graph where values are represented by a circle.
- CA way of recording data using marks.
2How do you construct a pie chart?
- AFind the total frequency
Divide 360 by the total to find how much each person gets
Calculate the angle for each slice
Draw a circle. Mark the center and draw a line straight up
Mark of the first angle . Draw a first line
Mark of the other angle. Measure from the last line drawn - BDraw a circle
Measure the size of each piece
Draw a line
Draw other line going of that original line
- AFind the total frequency
3This is a pie chart
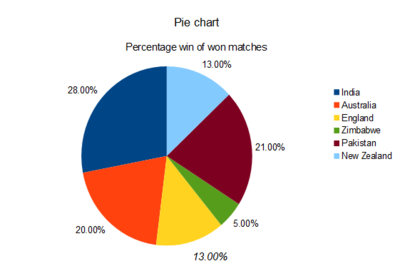
- AVerdadero
- BFalso
4What type of data is pie charts mainly used for?
- AScores
- BAverages
- CMost types of data
Información
- Descripción
- Test sobre Pie charts, creado por Stefan8890 el 01/07/2015.
- Autor
- Stefan8890
- Idioma
- English
- Visitas
- 28
- Valoración
- 2,5 de 5 · 2 valoraciones Valora este test