
Test
STAT Chapter 2
Este test tiene tipos de pregunta que se abren en el reproductor de siempre.
Preguntas del test (29)
1With qualitative data, categories and classes mean different things.
- AVerdadero
- BFalso
2The formula for relative frequency is [blank_start]rf=f/N[blank_end].
- Arf=f/N
3The formula for percent frequency is [blank_start]100(rf)[blank_end] or [blank_start]100f/N[blank_end]
- A100(rf)
- B100f/N
4The ways to summarize raw data are [blank_start]frequency distribution table[blank_end], [blank_start]bar chart[blank_end], and [blank_start]pie chart[blank_end].
- Afrequency distribution table
- Bsurvey
- Cbar chart
- Dperiodic table
- Epie chart
- Ffood chart
5Histograms eliminate raw data.
- AVerdadero
- BFalso
6Histograms must be continuous.
- AVerdadero
- BFalso
7Which of the following are the shapes of histograms?
- Askewed left
- Bsymmetric
- Ctransformative
- Dskewed right
- Equalitative
- Funiform
8Which of the following are true?
- ASubscripted variables are used for licensing
- BSubscripted variables are used for distinguishing/labeling
- CSubscripts can be added to any variable in a data set
9For a sample, the mean is denoted by "x bar".
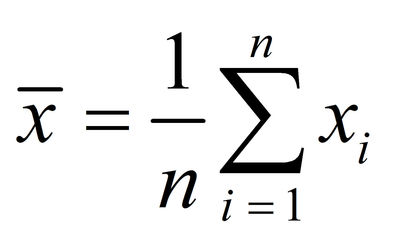
- AVerdadero
- BFalso
10x bar and sample mean are two different things.
- AVerdadero
- BFalso
11For a population, the mean is denoted by the Greek letter "mu"
- AVerdadero
- BFalso
12Why is the mean not the best measure to get the center of data?
- AThe formulas are the same algebraically
- Bsmall samples are extremely sensitive to large or small calculations (outliers)
13The median is not "immune" to outliers.
- AVerdadero
- BFalso
14Why is the mode not always a good indicator of the center of data?
- AThere could be no mode
- BThere could be one mode
- CThere could be more than one mode
- DThe mode(s) may be no where near the center of data
- EAll of the above
15Q1 is most easily calculated by finding the median of the [blank_start]bottom[blank_end] half of the data, where this [blank_start]bottom[blank_end] half excludes the overall median, m
- Abottom
- Btop
- Ctop
- Dbottom
16Q3 is most easily calculated by finding the median of the [blank_start]top[blank_end] half of the data, there this excludes the [blank_start]top[blank_end] half of the overall median, m
- Atop
- Bbottom
- Cbottom
- Dtop
17The height of the graph above each point is proportional to how densely the population data is concentrated in the immediate vicinity of the point; the higher the graph, the higher the concentration, the lower the graph, the lower the concentration
- AVerdadero
- BFalso
18The terminology used to describe density curves is different from the terminology used to describe the shapes of histograms
- AVerdadero
- BFalso
19What is the problem with range to measure the spread of a population or sample?
- AThe range is too big
- BEither of the two values can be an outlier
- CIt doesn't consider the shape of the data
- DThe range can be deflated making the spread appear smaller than it really is
- EThe range can be inflated making the spread appear bigger than it really is
- FChoices 1 and 3
- GChoices 2, 3, and 5
20For a symmetric bell shaped distribution
- Amedian < mean
- Bmedian = mean
- Cmedian > mean
21For a right skewed distribution graph
- Amedian < mean
- Bmedian = mean
- Cmedian > mean
22For a left skewed distribution graph
- Amedian < mean
- Bmedian = mean
- Cmedian > mean or mean < median
23If x is [blank_start]larger[blank_end] than the mean, then z is positive; if x is [blank_start]smaller[blank_end] than the mean, then z is negative, if x [blank_start]equals[blank_end] the mean, then z=0.
- Alarger
- Bsmaller
- Cequals
24About [blank_start]68[blank_end]% of the data is within 1 standard deviation of the mean (between µ−σ and µ+σ or z-scores -1 to 1)
- A68
- B99
- C95
25About [blank_start]95[blank_end]% of the data is within 2 standard deviations of the mean (between µ−2σ and µ+2σ or z-scores -2 to 2).
- A95
- B68
- C99
26"Distance" means number of standard deviations
- AVerdadero
- BFalso
27"Mound shaped" is another term used for "bell shaped and symmetric".
- AVerdadero
- BFalso
28Which of the following properties from Chebyshev's Theorem are different from the empirical formula?
- AUnlike the empirical rule which gives us the approximate fraction of data within 'k' standard deviation of the mean, Chebyshev's Theorem gives us the minimum fraction of data within 'k' standard deviation of the mean.
- BUnlike the empirical formula, k need not be an integer.
- CSince the minimum fraction of data within 'k' standard deviation of the mean is 1-1/k^2, the maximum fraction of data farther than 'k' standard deviations from the mean is 1/k^2
- DWhereas the empirical rules only holds for bell shaped, symmetric distributions, Chebyshev's Theorem is true for distributions of any shape.
29Which of the following are causes of outliers?
- AData value is observed or recorded incorrectly
- BData value is negligible
- CData value comes from a different population
- DData value is correct, but is a very unlikely value
Información
- Descripción
- Test sobre STAT Chapter 2, creado por Brianna Nelson el 19/09/2015.
- Autor
- Brianna Nelson
- Idioma
- English
- Visitas
- 1
- Valoración
- Aún sin valoraciones Valora este test