16428123
Description
Flashcards by Jem Kinney, updated more than 1 year ago
|
|
Created by Jem Kinney
almost 7 years ago
|
|
| Question | Answer |
| What could be used as meta data for biological data? | a) When the data were collected? b) Where the data were collected? c) The level of training of those people who collected the data? d) The specification of the machines used to analyse the data? |
| The line of best fit shoualways be shown on a scatter plot. | false |
| What should always be shown on a scatter plot? | - raw data points -scale and units |
| Under which circumstances does the mean = median = mode of a sample? | only for a symmetrical, unimodal distribution |
| standard error of the mean measures the variability of the raw data | false |
| The SE of the mean measures the uncertainty of the estimate of the population mean | true |
| SE of the mean measures the uncertainty of the estimate of the sample mean | false |
| The SE of the mean depends on the sample size | true |
| The SE of the mean can be estimated from several samples of the same population | true |
| Can Normal distributions be skewed? | no |
| Which distributions can be skewed? | Binomial Poisson Negative Binomial Unimodal |
| Would you take a log of data because the data are skewed, with a few small values and more larger ones | false |
| What is the population? | the population is the set of items of interest |
| What is the sample? | sample is the subset of the population we can actually study. |
| What is nominal data? | nominal variables are a type of qualitative variable, which merely describes data. |
| what is ordinal data? | Ordinal variables are a type of qualitative variable that places data into a meaningful order but the distance between ranks is non-quantitative. |
| What is ratio/scale data? | Ratio/scale data are numbers as multiples of one another. Also called numeric data. |
| What is parametric data? | parametric data is ratio/scale data where distributions are predictable and normal. |
| What is non-parametric data? | Nominal and ordinal data are non-parametric and do not assume any particular distribution. |
| What is metadata? | Information you need to understand the data. This can include; who collected the data, when, where , had they been trained, what methods and why, which instruments and had they been calibrated, where is data stored and archived. |
| What is a measure of location? | A single number used to characterize a batch, sample, or distribution or the position of an element of it. These include the mean, mode, median, range, standard deviation and standard error. |
| what is the standard deviation? | the average difference between an individual data point and the mean. |
| What is the range and what is it's limitation? | The range is the difference between the largest and the smallest value of individual cases and it is very susceptible to outliers . |
| What are the benefits of the interquartile range. | Outliers usually are not included so it is good for abnormal data. |
| what is skewness? | when the data are not symmetrical. |
| What is kurtosis? | Kurtosis is the length of the tails of frequency distribution - the propensity to produce outliers. this is not usually significant. |
| What is the standard error of the mean? | The standard error of the mean is a measure of the average differences between the sample means and the population means. σM = standard error of the mean σ = the standard deviation of the original distribution N = the sample size √N = root of the sample size |
| What data does the normal distribution apply to? | All continuous data and can be described just using the mean and standard deviation. |
| how to look for a normal distribution? | - look at it, is it bell shaped and curved - use a nomal probability plot - perform a formal test - KS for big data sets, SW for small - consider transforming data |
| What are the challenges of data acquisition? | - getting data into some form of database with as few errors as possible. - being able to retrieve data at a later date and make sense of it. |
| What should you use for data entry? | Software designed for data entry such as SPPS or access. Do not use excel as it is too easy to make mistakes such as deleting cells. |
| How to imput into spss | - single header row, then each subsequent row is a unique case or observation - each column should represent a variable need to define a case - Variable should be fully defined (e.g Numeric, scale or Ordinal?) |
| What file type should you store data as? | - CSV. file so it can be read on different software if the programme stops being used. - software specifc files. |
| Why is meta data important? | Meta dating recording is central to modern science as it allows data from different sources to be used together. |
| Why is exploratory data analysis important? | By visualising and exploring data before analysis, you get an idea of what tests you want to run. It is also helpful in giving you an idea of what to expect which can highlight issues in data entry or analysis further into testing. |
| Describe a box and whisker plot | - data visualisation It is a box with a line in the middle and two "whiskers" - line is the middle median value - box is the interquartile range -whiskers are the interquatile range - symetry suggests normal distrubution |
| Why is the scatter plot useful? | - it shows potential outliers and trends |
| What is signal and noise? | Signal is typically represented as some form of average and noise as some form of variation due to factors that don't interest us. |
| How is the noise useful? | It helps us assess our confidence that we have a good estimate of the signal. |
| What does a strong experimental design do in regards to signal and noise? | A strong experimental design involves trying to maximise the signal to noise ratio. |
| How do you increase the signal to noise ratio? | - by keeping conditions, excluding your independent variable, constant - by having the largest data set possible while keeping the experiment efficient. |
| What are the limitations of using the mean as a measure of location? | It can be very good if the data is normal and symmetrical. However, if there are extremes it can be misleading. |
| Are median an mode affected by extreme values? | No they are not. |
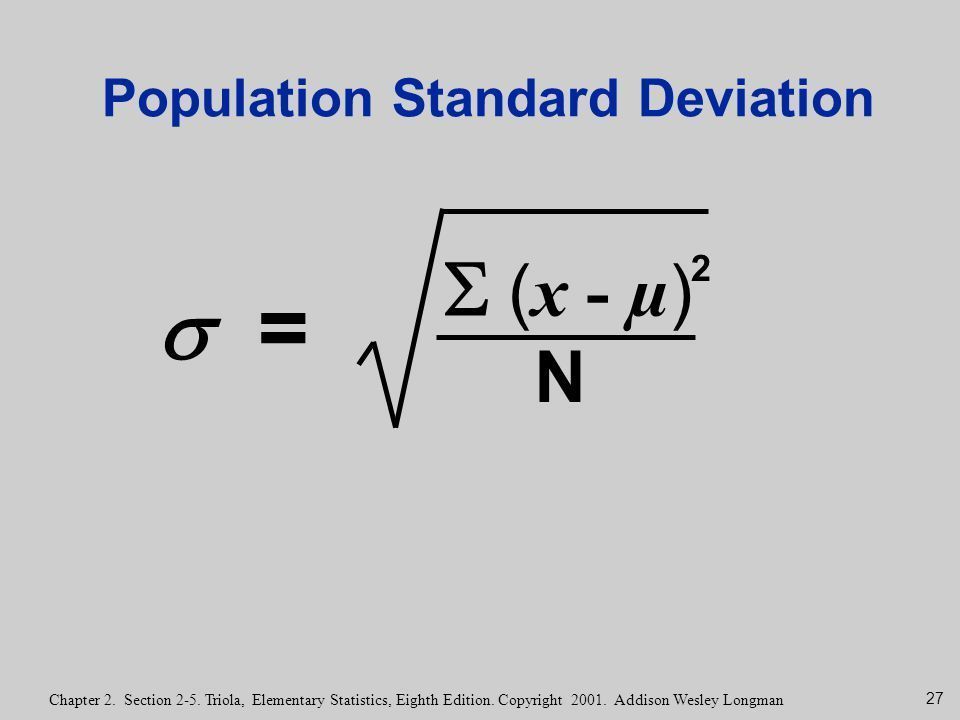
| How do you calculate the variability among the cases in a population? | the square root of the sum of squares divided by the number of cases. |
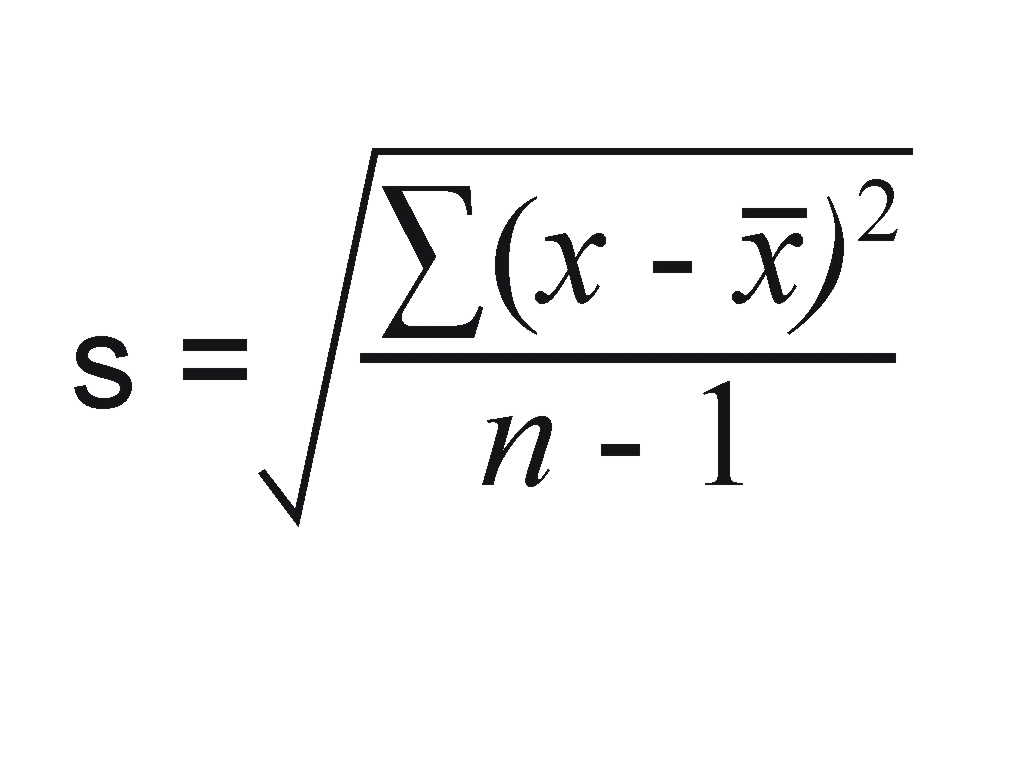
| How do you calculate the variability among cases in a sample? | Standard deviation of sample |
| What helps ensure a good estimate of the population mean? | The less variation among cases, and the larger the sample is, the more likely that the sample mean gives a good estimate of the population mean. |
| why do many statistical tests assume that data are normally distributed? | Because normal distribution is common in nature. Additionally, the means of multiple samples of the same population are distributed normally no matter what the distribution of the raw data is. |
| does scientific testing only work with falsifiable hypothesis? | yes |
| How do you desing a fair experiment? | - Maximise the signal to noise ratio - keep comparisons fair by using randomisation |
| what kind of error is accepting the null hypothesis when it false? | type II |
| what kind of error is rejecting the null hypothesis when it is true? | Type I error |
| what is the test for variance between the normally distributed samples of more than 2 treatments? | ANOVA |
| Test for differences between two abnormally distributed samples? | In statistics, the Mann–Whitney U test is a nonparametric test of the null hypothesis that it is equally likely that a randomly selected value from one sample will be less than or greater than a randomly selected value from a second sample |
| Test for differences between means of more that two abnormally distributes data. | Kruskal wallis test for differences between medians of more than two samples - non-parametric |
| How to undertake a hypothesis test | - propose a specific question -construct null hypothesis - design and run the study -> note reasoning and methods. - Collect, enter, valiadate and store the data and meta data. - Undertake Exploratory data analysis - choose statistical tests - run tests - Make a statistical desicion whether to reject or accept the null hypotheis |
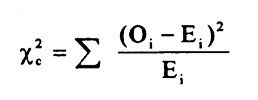
| How do you conduct analysis of categorical data? | - You use the chi square test - We use the null hypothesis to create a model of the population and see how likely it is that our sample could have come from that population |
| What is the null hypothesis of the chi square test? | That the model is correct and there is no variation from the predicted population |
| How do we run a chi square if we are testing independent categorical factors? | - the null hypothesis is that the variables are not associated - the expected joint probabilities are multiplied together -observed and expected values are compared. |
| what does the F value mean in ANOVA output? | An F statistic is a value you get when you run an ANOVA test or a regression analysis to find out if the means between two populations are significantly different. The larger the F value the less likely that the null hypothesis is true. |
| Possible issues with graphs looking at continuous numeric data | Scales can be used to manipulate the perception of data. |
| What correlation is correct to use for normal numeric data? | Pearson correlation a correlation coefficient commonly used in linear regression. A correlation coefficient indicates the extent to which dots in a scatterplot lie on a straight line. |
| What does one tail correlation look for? | One tail correlation just looks for the negative correlation or the positive correlation. |
| What does two tail correlation look for? | Two tail correlation looks for both a positive and negative correlation. |
| What is R? | A correlation coefficient which indicates the extent to which dots in a scatterplot lie on a straight line. |
| What does the value of R mean? | Correlations are never lower than -1. A correlation of -1 indicates that the data points in a scatter plot lie exactly on a straight descending line; the two variables are perfectly negatively linearly related. A correlation of 0 means that two variables don't have any linear relation whatsoever. However, some non linear relation may exist between the two variables. Correlation coefficients are never higher than 1. A correlation coefficient of 1 means that two variables are perfectly positively linearly related; the dots in a scatter plot lie exactly on a straight ascending line. |
| What does linear correlation struggles with? | - R might not be significant, in which case use spearmans rank - R is close to 0, simple correlation does not work. |
| When transforming data for correlation do you need to transform both sets of data? | No you can just transform one if you like |
| Does correlation imply causality? | No, two variables may change in the same way for different reasons. |
| What is Principle component analysis? | Principle component analysis attempts to reduce the number of variables by creating new ones that capture most of the variation. |
| What strategies may you use in multivariate analysis looking for relationships among many variables. | - Principle component analysis - CANOCO - Factor Analysis |
| Multivariate analysis when classifying the cases into groups. | -cluster analysis |
| What is the use of regression? | To describe the effect through building a model rather than testing for effect (correlation) It also allows forecasting values. |
| Which values are known in regression? | X values (independent) |
| Which values are estimated? | Y values (dependant) |
| What does regression assume? | that there are margins of error in the y values but not the x values. |
| How is the line of best fit calculated in regression? | The line of best fit is calculated by minimising the sum of squares of the residuals |
| What assumptions are present in regression? | - X variable is known and set by the experimenter - y variable is unknown in advance and Is drawn from a larger population. - relationship is linear - both x and y values are normally distributed. |
| What is the adjusted R^2 value? | A measure of how well the line fits with 1.00 being perfect. Adjusted R-squared gives the percentage of variation explained by only those independent variables that in reality affect the dependent variable |
| What is interpolation? | Using equation to forecast y values within the range of regression data. |
| What is extrapolation? | Forecasting y values from outside of your range of regression data. Can be quite inaccurate as it assumes that the relationship does not change beyond the current data. |
| What do you do if the relationship is not linear? | - Transform one or bothe variables - use more complex regression model |
| How do you conduct regression if there are more than two variables? | - Use multiple linear regression - Not all variables are always needed |
| How do you select the best model? | You can use stepwise regression which involves adding variables one at a time, starting with the best model, until there is no further improvement to fit the data. |
| What is the null hypothesis for a one way anova? | No difference among the sample means |
Want to create your own Flashcards for free with GoConqr? Learn more.