3529421
| Question | Answer |
| (Upward-Sloping) Supply Curve | The graphical representation of the law of supply. |
| Absolute (Money) Price | The price of a good in money terms. |
| Bad | Anything from which individuals receive disutility or dissatisfaction. |
| Base Year | The year chosen as a point of reference or basis of comparison for prices in other years; a benchmark year. |
| Boldface | The most highly valued opportunity or alternative forfeited when a choice is made. |
| Bond | An IOU, or a promise to pay. |
| Business Cycle | Recurrent swings (up and down) in Real GDP. |
| Capital Consumption Allowance (Depreciation) | The estimated amount of capital goods used up in production through natural wear, obsolescence, and accidental destruction. |
| Comparative Advantage | The situation in which someone can produce a good at lower opportunity cost than someone else can. |
| Complements | Two goods that are used jointly in consumption. If two goods are complements, the demand for one rises as the price of the other falls (or the demand for one falls as the price of the other rises). |
| Consumer Price Index (CPI) | The weighted average of prices of a specific set of goods and services purchased by a typical household; a widely cited index number for the price level. |
| Consumers' Surplus (CS) | The difference between the maximum price a buyer is willing and able to pay for a good or service and the price actually paid. (CS = Maximum buying price - Price paid.) |
| Consumption | The sum of spending on durable goods, nondurable goods, and services. |
| Cyclical Unemployment Rate | The difference between the unemployment rate and the natural unemployment rate. |
| Deadweight Loss | The loss to society of not producing the competitive, or supply-and-demand?determined, level of output. |
| Demand | The willingness and ability of buyers to purchase different quantities of a good at different prices during a specific period. |
| Demand Curve | The graphical representation of the law of demand. |
| Demand Schedule | The numerical tabulation of the quantity demanded of a good at different prices. A demand schedule is the numerical representation of the law of demand. |
| Disequilibrium | A state of either surplus or shortage in a market. |
| Disequilibrium Price | A price other than the equilibrium price. A price at which the quantity demanded does not equal the quantity supplied. |
| Disposable Income | The portion of personal income that can be used for consumption or saving. It is equal to personal income minus personal taxes (especially income taxes). |
| Disutility | The dissatisfaction one receives from a bad. |
| Dividend | A share of the profits of a corporation distributed to stockholders. |
| Double Counting | Counting a good more than once when computing GDP. |
| Dow Jones Industrial Average (DJIA) | The most popular, widely cited indicator of day-to-day stock market activity; a weighted average of 30 widely traded stocks on the New York Stock Exchange. |
| Economic Growth | Increases in Real GDP. |
| Employment Rate | The percentage of the civilian noninstitutional population that is employed: Employment rate = Number of employed persons + Civilian noninstitutional population. |
| Equilibrium | Equilibrium means "at rest." Equilibrium in a market is the price-quantity combination from which buyers or sellers do not tend to move away. Graphically, equilibrium is the intersection point of the supply and demand curves. |
| Equilibrium Price (Market-Clearing Price) | The price at which the quantity demanded of a good equals the quantity supplied. |
| Equilibrium Quantity | The quantity that corresponds to the equilibrium price. The quantity at which the amount of the good that buyers are willing and able to buy equals the amount that sellers are willing and able to sell, and both equal the amount actually bought and sold. |
| Exports | Total foreign spending on domestic (U.S.) goods. |
| Face Value (Par Value) | Dollar amount specified on a bond; the total amount the issuer of the bond will repay to the buyer of the bond. |
| Final Good | A good in the hands of its final user. |
| Fixed Investment | Business purchases of capital goods, such as machinery and factories, and purchases of new residential housing. |
| Frictional Unemployment | Unemployment that is due to the natural so called frictions in the economy and that is caused by changing market conditions and represented by qualified individuals with transferable skills who change jobs. |
| Full Employment | The condition that exists when the unemployment rate is equal to the natural unemployment rate. |
| Futures Contract | An agreement to buy or sell a specific amount of something (a commodity, a currency, a financial instrument) at an agreed-on price on a stipulated future date. |
| Good | Anything from which individuals receive utility or satisfaction. |
| Government Purchases | Federal, state, and local government purchases of goods and services, and gross investment in highways, bridges, and so on. |
| Government Transfer Payments | Payments to persons that are not made in return for currently supplied goods and services. |
| Gross Domestic Product (GDP) | The total market value of all final goods and services produced annually within a country’s borders. |
| Imports | Total domestic (U.S.) spending on foreign goods. |
| Inferior Good | A good for which demand falls (rises) as income rises (falls). |
| Inflation | An increase in the price level. |
| Initial Public Offering (IPO) | A company's first offering of stock to the public. |
| Intermediate Good | A good that is an input to the production of a final good. |
| Inventory Investment | Changes in the stock of unsold goods. |
| Investment | The sum of all purchases of newly produced capital goods, changes in business inventories, and purchases of new residential housing. |
| Investment Bank | A firm that acts as an intermediary between the company that issues the stock and the part of the public that wishes to buy it. |
| Labor Force Participation Rate (LFPR) | The percentage of the civilian noninstitutional population that is in the civilian labor force: Labor force participation rate = Civilian labor force + Civilian noninstitutional population. |
| Law of Demand | As the price of a good rises, the quantity demanded of the good falls, and as the price of a good falls, the quantity demanded of the good rises, ceteris paribus. |
| Law of Diminishing Marginal Utility | Over a given period, the marginal (or additional) utility or satisfaction gained by consuming equal successive units of a good will decline as the amount consumed increases. |
| Law of Increasing Opportunity Costs | As more of a good is produced, the opportunity costs of producing that good increase. |
| Law of Supply | As the price of a good rises, the quantity supplied of the good rises, and as the price of a good falls, the quantity supplied of the good falls, ceteris paribus. |
| Macroeconomics | The branch of economics that deals with human behavior and choices as they relate to highly aggregate markets (e.g., the market for goods and services) or the entire economy. |
| Market | Any place people come together to trade. |
| Microeconomics | The branch of economics that deals with human behavior and choices as they relate to relatively small units: an individual, a firm, an industry, a single market. |
| National Income | Total income earned by U.S. citizens and businesses, no matter where they reside or are located. National income is the sum of the payments to resources (land, labor, capital, and entrepreneurship): National income = Compensation of employees + Proprietors’ income + Corporate profits + Rental income of persons + Net interest. |
| Natural Unemployment | Unemployment caused by frictional and structural factors in the economy: Natural unemployment rate = Frictional unemployment rate + Structural unemployment |
| Net Domestic Product (NDP) | GDP minus the capital consumption allowance. |
| Net Exports | Exports minus imports. |
| Neutral Good | A good for which demand does not change as income rises or falls. |
| Nominal Income | The current dollar amount of a person’s income. |
| Normal Good | A good for which demand rises (falls) as income rises (falls). |
| Normative Economics | The study of "what should be" in economics. |
| Option | A contract that gives the owner the right, but not the obligation, to buy or sell shares of a stock at a specified price on or before a specified date. |
| Own Price | The price of a good. For example, if the price of oranges is $1, this is its own price. |
| Personal Income | The amount of income that individuals actually receive. It is equal to national income minus undistributed corporate profits, social insurance taxes, and corporate profits taxes, plus transfer payments. |
| Positive Economics | The study of "what is" in economics. |
| Price Ceiling | A government-mandated maximum price above which legal trades cannot be made. |
| Price Floor | A government-mandated minimum price below which legal trades cannot be made. |
| Price Index | A measure of the price level. |
| Price Level | A weighted average of the prices of all goods and services. |
| Producers' (Sellers') Surplus (PS) | The difference between the price sellers receive for a good and the minimum or lowest price for which they would have sold the good. (PS = Price received - Minimum selling price.) |
| Production Possibilities Frontier (PPF) | The possible combinations of two goods that can be produced during a certain span of time under the conditions of a given state of technology and fully employed resources. |
| Productive Efficient | The condition in which the maximum output is produced with the given resources and technology. |
| Productive Inefficient | The condition in which less than the maximum output is produced with the given resources and technology. Productive inefficiency implies that more of one good can be produced without any less of another being produced. |
| Real GDP | The value of the entire output produced annually within a country’s borders, adjusted for price changes. |
| Real Income | Nominal income adjusted for price changes. |
| Relative Price | The price of a good in terms of another good. |
| Shortage (Excess Demand) | A condition in which the quantity demanded is greater than the quantity supplied. Shortages occur only at prices below the equilibrium price. |
| Spontaneous Order | The spontaneous and unintended emergence of order out of the self-interested actions of individuals; an unintended consequence of human action, with emphasis placed on the word "unintended." |
| Stock | A claim on a corporation's assets that gives the purchaser a share of ownership in the corporation. |
| Structural Unemployment | Unemployment due to structural changes in the economy that eliminate some jobs and create others for which the unemployed are unqualified. |
| Subsidy | A monetary payment by government to a producer of a good or service. |
| Substitutes | Two goods that satisfy similar needs or desires. If two goods are substitutes, the demand for one rises as the price of the other rises (or the demand for one falls as the price of the other falls). |
| Supply | The willingness and ability of sellers to produce and offer to sell different quantities of a good at different prices during a specific period. |
| Supply Schedule | The numerical tabulation of the quantity supplied of a good at different prices. A supply schedule is the numerical representation of the law of supply. |
| Surplus (Excess Supply) | A condition in which the quantity supplied is greater than the quantity demanded. Surpluses occur only at prices above the equilibrium price. |
| Technology | The body of skills and knowledge involved in the use of resources in production. An advance in technology commonly increases the ability to produce more output with a fixed amount of resources or the ability to produce the same output with fewer resources. |
| Tie-in Sale | A sale whereby one good can be purchased only if another good is also purchased. |
| Total Surplus (TS) | The sum of consumers' surplus and producers' surplus. (TS = CS + PS.) |
| Transfer Payment | A payment to a person that is not made in return for goods and services currently supplied. |
| Unemployment Rate | The percentage of the civilian force that is unemployed: Unemployment rate = Number of unemployed persons + Civilian labor force. |
| Utility | The satisfaction one receives from a good. |
| Yield | The annual coupon payment divided by the price paid for a bond. |
| Adam Smith | Conceived the idea of the “invisible hand”. |
| Adam Smith | 1776 – An Inquiry into the Nature and Causes of the Wealth of Nations |
| Who is considered the father of modern economics and the inventor of the term “invisible hand”? Name his most famous book, published in 1776. What does “invisible hand” mean? | Adam Smith is considered the father of economics and coined the term “invisible hand” in order to describe the natural growth of a free market. Smith said, “He neither intends to promote the public interest, nor know how much he is promoting it. He intends only his own gain, and he is in this, as in many other cases, led by an invisible hand to promote an end which was no part of his intention”. “Led by an invisible hand to promote an end” is speaking to the natural growth that is realized during a free market as a side effect of one’s own naturally selfish behavior |
| b. Did economists in England in the 1800’s get to watch any major economic developments occur? List at least three. | 1. The wages of common laborer’s increased eight-fold as a result of the Industrial Revolution. 2. The Panic of 1873 which triggered the “Long Depression” in Europe. 3. In 1815, Napoleon lost the Battle of Waterloo causing British debt to soar in value. |
| c. One famous economist served as a delegate to the Versailles Peace Conference that ended WWI. He disagreed with the settlement terms imposed by his government and wrote a book that predicted WWII. Name him and the book. | John Maynard Keynes served as a delegate to the Versailles Peace Conference and wrote The Economic Consequences of the Peace. |
| d. Who was inspired by books like Friedrich Hayek’s like The Road to Serfdom and The Pretense of Knowledge? | Margaret Thatcher (Only female British PM) |
| e. What duo co-wrote a ground-breaking book on monetary policy? State the authors and the name of the book. | Milton Friedman and Anna Schwartz co-wrote Monetary History of the United States 1867 ‐ 1960 |
| f. Describe Lucas’ view of Rational Expectations; what did his first wife expect after their divorce? | Lucas’ theory of Rational Expectations basically states that the decisions each individual makes are a result of both past experiences and rational theories about what will happen in the future, making any macroeconomic model that is based solely on past data flawed. |
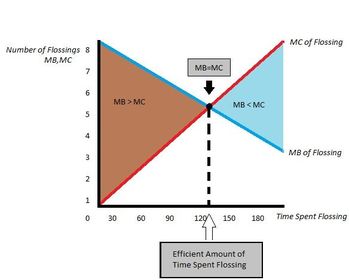
| 2) Draw a graph that depicts the balance between the marginal benefits of flossing your teeth in terms of the number of flossings per week and the marginal costs of flossing your teeth in terms of the expenditure of time. Label the efficient point and the areas on your graph where marginal cost and marginal benefits are unbalanced. In 100 words or less, explain how opportunity cost is related to your graph. | As depicted in the graph above, as more time is spent flossing the marginal benefit rises only until the point of equilibrium- at which point the marginal cost of additional time spent flossing begins to outweigh the marginal benefit of it. The same is true in regard to flossing more or less often; while flossing 5 times a week is more beneficial than just 4, flossing 7 times a week is marginally less beneficial than 5. |
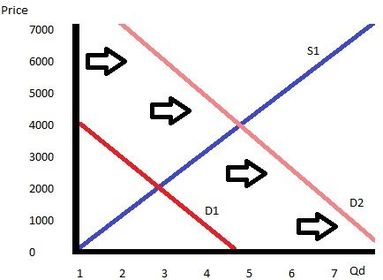
| 3) Draw and label a graph that shows the market for horses and how that market would change with a new law requiring everyone with a previous D.U.I. to travel only by horseback. Describe your result in 100 words or less, including how this is related to scarcity. | 3) Draw and label a graph that shows the market for horses and how that market would change with a new law requiring everyone with a previous D.U.I. to travel only by horseback. Describe your result in 100 words or less, including how this is related to scarcity. The graph above depicts the market for horses before and after a change in law requiring D.U.I. offenders to travel solely by horseback. S1 represents the supply curve, while D1 represents the demand curve before the change in law, with D2 representing the demand curve after the change has taken place. As shown, when the demand increases the demand curve shifts to the right. |
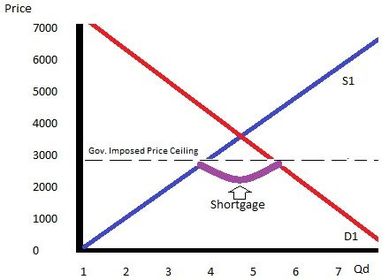
| 4) Draw and label a graph that shows the market for horse and how that market would change with a government imposed maximum price for horses below the market price for horses. Describe your result in 100 words or less, including how this is related to scarcity. | The graph above depicts the horse market with and without a government imposed maximum price that is below market value. As shown, limiting the maximum price causes an imbalance (disequilibrium) whereby the demand for horses at a given price exceeds the supply. The graph above shows scarcity at work, as the want for horses exceed the limited supply of them. |
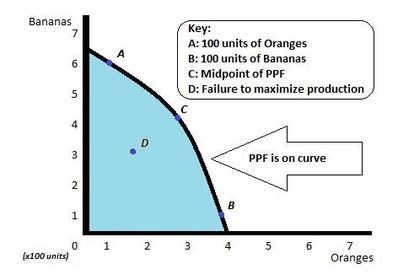
| 5) Draw and label a Production Possibilities Frontier with two items of your own choosing. Mark an intersection point (A) on the y-axis with 100 units of one good and an intersection point (B) on the x-axis with 100 units of the other good. Create and label a third point (C) roughly in the middle of the PPF. Mark a fourth point (D) that represents failure to maximize production. | |
| 6) Review the Law of Demand and the Law of Supply and the function of Prices. For the law of supply and the law of demand write the law, draw the standard associated graph and state why the line or curve its shape. For prices, state the two functions of price. | Law of Supply: As the price of goods rises, so does the supply. Likewise, as the price of goods falls, so does the supply (ceteris paribus). Law of Demand: As the price of goods rises, the demand falls. Likewise, as the price of goods falls, the demand rises (ceteris paribus). Typical graph showing supply and demand: Price: The two functions of price as applied to macroeconomics as a whole are rationing and allocating (signaling). Setting the price to a level not obtainable by all consumers acts to ration the product, while a change in price can serve as a signaling device to producers and consumers alike. A producer may signal to the consumer by lowering the price- causing the consumer to choose between them and a competitor. A consumer may also raise the price, signaling to other producers to do likewise. |
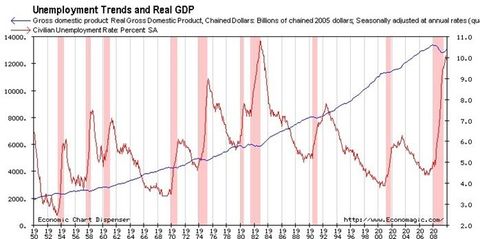
| 7) For A to E below, please refer to the following chart. | |
| A) List, approximately, the highest and lowest Real GDP in the United States during this period. | Highest: +- 13800 Lowest: +- 2000 |
| B) List, approximately, the highest and lowest unemployment rates in the United States during this period. | Highest: +- 10.9 Lowest: +- 2.5 |
| C) Officially designated recessions are marked in pink on the chart. What seems to be true about unemployment and real GDP during these periods? | The unemployment rate rises while the GDP falls. |
| D) In 100 words or less, would a high inflation rate increase or decrease real GDP? | High inflation rates would in theory have no effect on real GDP ceteris paribus. Real GDP is a measure of quantities not prices, so it theoretically would account for a rise in inflation. I do think that it’s possible that a high inflation rate could indirectly effect GDP by making it more expensive to produce goods since it may take time for the economy to find equilibrium again after rising, but I’m unable to find anything to support this idea. |
| E) In 100 words or less, pick any year and explain why it would have been good or bad to be classified as a frictionally unemployed worker in that particular year, include the definition of frictional unemployment in your answer. | Frictional Unemployment is defined as unemployment due to the natural frictions of an economy caused by changing market conditions, and represented by qualified individuals with transferrable skills who change jobs. In other words, someone who should have no trouble finding a job being unemployed. To be frictionally unemployed during the recession of 2008 would have been particularly bad, as this period experienced unemployment rates above 10%. High demand for jobs would have caused it to be an “employer’s market” making it more difficult to find work as well as almost impossible to negotiate terms in the employee’s favor. |
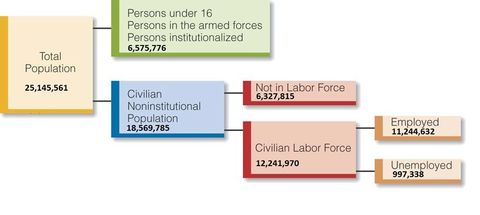
| 8) Draw and label the standard breakdown of population and labor force as a flow chart showing the various classes of the entire population necessary to accurately measure the unemployment rate. Utilize actual data for the State of Texas from the 2010 Census and from the Bureau of Labor Statistics website to fill in your exhibit. Below your exhibit show your calculations for the State of Texas’ 2010 unemployment rate, employment rate, and labor force participation rate. | Unemployment Rate: (Unemployed / CLF) 997,338 / 12,241,970 = 0.081 (8.1%) Employment Rate: (Employed / CNP) 11,244,632 / 18,569,785 = 0.605 (60.5%) Labor Force Participation Rate: (CLF / CNP) 12,241,970 / 18,569,785 = 0.659 (65.9%) |
| 9) Explain the difference between a stock and a bond. Then, provide the answers requested in A to E below: | A stock is a portion of the company whereas a bond is a debt owed by the company to be repaid with interest. Stocks are bought either to yield dividends, to be bought low and sold high, or both. Bonds are bought in order to earn interest on the debt. |
| A. State the formula for the yield on a stock | Yield = Dividend per share / Closing Share Price |
| B. State the formula for the price – earnings ratio of a stock | P-E Ratio = Closing Share Price / Net Earnings Per Share |
| C. Define the term face value or par value | Face Value is the amount to be paid upon maturity of a bond. |
| D. Define the terms annual coupon payment and coupon rate | Annual Coupon Payment is the annual payment made to a bond holder based on the coupon rate. (CP=CR*FV) The coupon rate is the percentage of the face value the bond holder receives each year until maturity. (CR=CP/FV) |
| State the formula for yield or interest rate on a bond | The formula for yield or interest rate of a bond is: Yield = Coupon Payment / Price of Bond |
| Ceteris Paribus | All other things equal (Latin) |
Want to create your own Flashcards for free with GoConqr? Learn more.