3779688
Description
Flashcards by Georgia Tan, updated more than 1 year ago
|
|
Created by Georgia Tan
about 10 years ago
|
|
| Question | Answer |
| What is confirmation bias? | Confirmation bias: If the data is there, people often use it in a biased way to support whatever preconceived opinion they have |
| "accept that the treatment worked if the number of 6’s is larger than a cut-off value c" Do we do this before, during or after we have analyzed the data? | before. to avoid confirmation bias |
| All statistical tests have two elements - name them | 1. A measure T, calculated from the data, that allows us to assess the strength of the evidence for the claim 2. An acceptance criterion specified by cut-off value(s) c . One-sided tests (covered in this class) Accept the claim if T > c : the larger T the more evidence for the claim Accept the claim if T < c: the smaller T the more evidence for the claim |
| What is a false positive error? | Testsaysthatthe managerial intervention worked but it actually didn’t |
| What is a false negative error? | Testsaystheintervention didn’t work but it actually did |
| We should focus on avoiding what kind of error? | false positive |
| significance level = a test procedure’s probability of producing a______ error | false positive; , i.e., of producing a positive test result when there is no effect |
| The significance level is chosen ______ we see the data – The p-value is calculated ____ we see the data – it is a summary statistic of the data | before; after |
| A statistical test only controls the probability of a false ______ error The probability of a false ______ error can be very large | positive; negative |
| The chance of a false negative can be as large as_________ of the test | 1- significance level |
| For single variables, the most important graphs are: (name 3) | Histogram Percentile Curve Line Graph |
| For multiple variables, the most important graphs are: | scatter plots |
| Since intercept and slope are statistics, they have ____ | sampling distributions |
| A high correlation coefficient is always: | an indication of a strong relationship |
| A low correlation coefficient is | not an indication that there is no relationship |
| The significance level tests the claim: “The slope is not zero”...... | against the null hypothesis “The slope is zero” |
| The larger the unknown slope is, the more likely it is that | the data will provide evidence that there is a slope |
| A very small slope can be highly significant in one of the following two situations: | A very small slope can be highly significant in one of the following two situations: (a) you have lots of data (the standard error for the slope goes to zero as N goes to infinity) (b) the population regression line fits the data exceptionally well (high R^2) |
| The confidence interval for the slope gives you information about: | the size of the unknown slope of the population regression line |
| If two variables X and Y are correlated, information about X can | improve the prediction of the average of Y |
| If an omitted variable is the reason for the correlation, then changing X: | may not change the omitted variable and hence have no effect on Y |
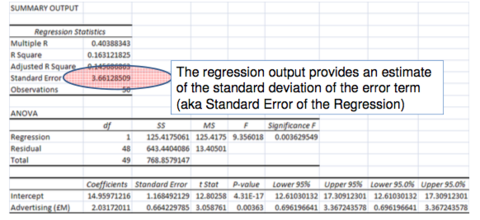
| R-square is often used as a “measure of fit” What does this actually mean? | R-square can be interpreted as the percentage of variation in the response variable Y that is explained by the variation in the predictors X |
Want to create your own Flashcards for free with GoConqr? Learn more.