
6582019
Description
| Question | Answer |
| What is GIS? | - 1987 Department of the Environment - 'a system of capturing, storing, checking, integrating, manipulating, analysing and displaying data which are spatially referenced to Earth' - Heywood (2002) - Real GIS should have: 1. A computer system 2. Use spatially referenced geographical data 3. Carry out analysis tasks on the data to produce non- spatial output (tables) or spatial output (maps) |
| What are the components of GIS? | Depends on how sophisticated it is... 1. Software package with tools to enter, manipulate, analyse and display data 2. Computer 3. Spatial data 4. Data management and analysis procedures 5. The people who operate it 6. The overall network as a whole |
| What is meant by the computer system and software component of GIS? | - A sufficient processor and memory - Disk space for storage - Good quality, high resolution screen - Scanners, printers, plotters, friendly user face - Flexible and powerful software |
| What is meant by the spatial data component of GIS? | - Contains information on the location geographical entries and relationship to other entities - Points, line and polygons stored in the GIS in either raster or vector data format |
| What is meant by the spatial data management and analysis procedures components of GIS? | - Geographic and attribute data input - Data management and analysis (transformation/ storage and retrieval/ queries and modelling |
| What is meant by the people of GIS as a component of it? | - People who design, implement and operate the system |
| What is GIS used for? | - In government for health, land use planning, transport planning, urban management - For businesses, market share analysis, insurance and retail site selection - Utilities - telecommunications, emergency, network and route management - Environmental protection - pollution monitoring, natural hazard assessment, EIA, resource management - Route finding |
| What did Burroughs and McDonnell say of their definition of GIS? | - A set of tools for collecting, storing, retrieving at will (real time and instant results), transforming and displaying spatial data from the real world for a particular set of purposes |
| What really are GIS and maps? | - Representations of the real world in a digital form - A 'synthesis' of data (Chorley) - Simplifications of complexity - Digital models that show how and why elements interact and the relationships between features - Tools that aid decision - making |
| What is the reality of trying to communication information about reality in addition to location? | - It is complex and difficult to comprehend- real life scenarios are hard to appreciate and explain - It is larger than we can perceive or imagine - Has a seemingly infinite detail - Cannot be transported |
| What is the medium used to communicate the reality of information in addition to location? | MAPS - They simplify reality, choosing details to stop them being overcomplicated - Can be handled - Show features smaller than reality (scale is very important) - Omit many details apparent in reality - Are portable |
| How is data converted into information? | - Data sometimes doesn't mean anything until it is converted into either qualitative or quantitive - Information can come from observations, facts, evidence, measurements and raw numbers |
| What questions should you ask of data? | 1. What does the data refer to? 2. What are the units of measurements? 3. What is the scale? 4. Where are they for? Information should have context, meaning and relationships with other features (I.E. maps need labels to turn data into information) |
| What are the three modes/ dimensions of information? | 1. Spatial 2. Thematic 3. Temoral |
| What are the cartographic principles that underpin map making? | 1. Purpose (audience and the message) - overviews, roads, route planning, urban areas, geologic data 2. Scale 3. Symbolisation 4. Generalisation (tree species --> woodland) 5. Projection and referencing - referenced to the Earth's surface 6. Annotation |
| What is different about tube network maps? | *They are topographically inaccurate (not geographically true) *They are topologically accurate (truly are connected) |
| What is meant by cartographic scale? | - The ratio of a distance on the map to the corresponding distance on the ground |
| What are the different expressions of scale? | 1. A STATEMENT - e.g. one inch to one mile 2. A GRAPHIC ELEMENT - e.g. a scale bar 3. A REPRESENTATIVE FRACTION - e.g. 1:100 4. A RATIO - e.g. 1/100 5. THE SPACING OF A GRATICULE - (the gridlines on the map placed at regular intervals) 6. A LENGTH OF TIME (or other continuous variable) |
| What are the equations for calculating and interpreting scale? | Dg = distance on ground Dm = distance on map f = representative fraction Dg= Dm*f Dm = Dg / f f = Dg/ Dm |
| What is important to remember with scales on maps? | * The larger the thing on the map, the larger the scale (smaller ratio number) * Scale of journeys can be given as a time to a set distance *Be careful about the units! |
| What is meant by discrete objects and continuous fields? | DISCRETE OBJECTS: Well - defined objects in an otherwise empty space (E.g. cars, computers, people) CONTINIOUS FIELDS: Defined by variables which are measurable at every point on the Earth's surface (E.g. terrain, population density) |
| How are spatial features represented? | 1. Lines 2. Areas 3. Points 4. Surfaces - no defined edges or boundaries 5. Networks - set of connected lines |
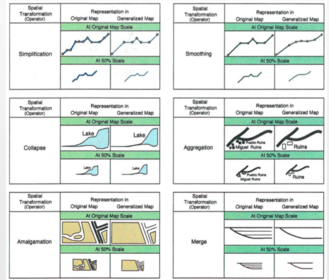
| What are the generalisation methods (1)? | |
| What are the generalisation methods (2)? | |
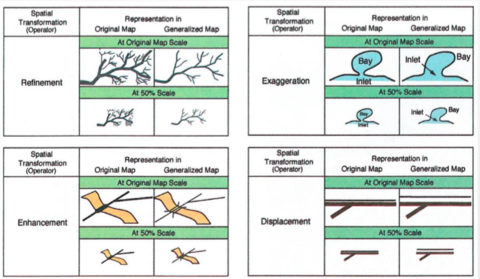
| What are the names of the generalisation methods? | 1. Simplification 2. Smoothing 3. Collapse 4. Aggregation 5. Amalgamation 6. Merge 7. Refinement 8. Exaggeration 9. Enhancement 10. Displacement |
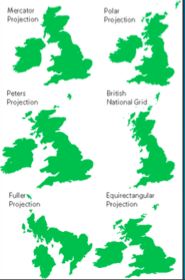
| What are the issues with some map projections? | - Curvature of the Earth creates problems for mapping on a flat surface (the spatial features become distorted) - The Earth bulges around the equator so that the shape is an 'oblate spheroid' (not a sphere) - Map projections transform the geographic locations of features into mathematically corresponding positions on a 2D surface |
| What 3 things do map projections distort/ preserve? | 1. Distances 2. Angles 3. Areas (No map projection can preserve all 3 - only the globe can) |
| What are the 3 basic classes of map projection? | 1. Cylindrical - usually used for equal area projections (polar regions exaggerated) just split into squares 2. Azimuthal - Usually used for equidistant projections - maintains distance from a centre point 3. Conical - used for conformal projections (how the features are represented to each other) |
| What is meant by Geo- referencing? | - In addition to the projection (3D to 2D) used, features need to be referenced to one another to 'tie' their locations together using a 1. geographic co- ordinate system - graticules (latitude and longitude) 2. Rectangular co-ordinate system (A nested set of cells) 3. non- co-ordinate system - annotation and map elements |
| What is important for generalisation? | 1. What features to preserve? 2. How much detail to preserve? 3. Emphasise certain features relative to others 4. Often related to scale 5. A number of methods (simplification/ exaggerated / symbolisation/ classification/ induction) |
| What is the difference between spatial data models and spatial data structures? | Spatial data model - The type of data model used to represent the data Spatial data structure - How the spatial data model is stored to enable the GIS to read and display the data |
| What are the increasing levels of abstraction? | Going from real world to a computer model 1. Real world - identify spatial features of interest and represent them in a conceptual model 2. Represent the conceptual model as a spatial data model 3. Select the appropriate spatial data structure 4. The computer model |
| What transformation stages are there within GIS? | 1. Real world 2. Raw data 3. Data model (includes data manipulation) 4. Data output |
| What are the important questions before creating GIS? | - When modelling the real world, what are you wanting to map? - Is the GIS going to be useful? - Is it necessary to display something visually? - Making sure its understood that you know how to use and apply the data - What is your research question? - What data is already available? |
| How are features represented in a conceptual model? | *3 main feature types 1. Points - an x,y coordinate pair 2. Lines - sets or ordered coordinate pairs 3. Areas - sets of lines that close to form a polygon *2 extended future types 1. Surfaces 2. Networks |
| What are the key types of spatial data models? | 1. Raster - grid cells (size is important - detail vs. data) 2. Vector - points, lines and areas - number of points determines the complexity of the shape (accuracy vs. redundancy (too detailed)) 3. Network - extends vectors to provide additional connectivity information 4. Surface - extends raster or vector to show variations in coverage across a region |
| How is data encoded into the computer? | - Data is stored within GIS in x, y coordinates - Features are coded as either a presence or an absence or given data - Data values are inputted along with meta data (header information - data about the data) -They are GIS software specific |
| What is meant by spaghetti files in vector data structures? | All points are connected (you wouldn't know how so, just that they are connected) |
| What is meant by attribute storage in raster and vector GIS? | Raster - Values stored in cells corresponding to a designated code (e.g. 1 = grass, 2 = water) Vector - Attributes sotred in tables and linked to spatial entries (polygons can light up when hilgihted in GIS) |
| How do raster and vector data models differ? | 1. Volume of data, raster = dependent on cell size, vector = dependant of density of vertices 2. Key sources of data - raster = remote sensing and imagery, vector = social and environmental 3. Key applications - raster = Resources and environmental, vector = social, economic and administrative 4. Software - raster = raster GIS, image processing, vector = vector GIS, automated cartography 5. Resolution - raster = fixed, vector = variable |
| What are topological data structures? | - Show the geometric relationships between spatial entries - Topological relationships remain constant even when the geographic space of objects is distorted - (Could be adjacency, containment or connectivity/ intersections) |
| What are the key features of a topological data structure? | 1. No duplication of node or line segments 2. Line segments and nodes may be referenced to more than one polygon 3. All polygons have unique IDs 4. Island and hole polygons can be represented |
| Why is topology important in GIS? | - For data validation/ error checking/ editing of features - Snapping - gaps in points close together but not touching is closed by GIS - Auto closure - Tracing - Intersecting - Is key to many spatial operations and queries (adjacent to/ intersects with/ overlaps/ contained within/ connected to?) |
| What are network data models? | - Model the flows (of people/ goods/ traffic/ information etc.) not just static spatial space - Adaption of the vector data model - Point (nodes) and lines/ segments - Different types of nodes (important to show connectivity) - Impedances - Topology vital |
| What are surface data models? | - Digital terrain models (DTMs) *Model a topographic surface *Not just land (population/ pollution etc) - Raster approach *Grid of height values - Vector approach *Triangulated irregular network (TIN) |
| What are object - orientated data models? | *Combine geometry, attributes and behaviour - Objects can be roads/ house/ power lines etc. - Geometry - point, line and polygons - Properties - width, constructed of, species - Methods - how drawn onto screen, how deleted, when snapped RELATIONSHIPS BETWEEN OBJECTS IN SAME AND DIFFERENT CLASSES - Topological (connected and closed) - Geographic (overlap and adjacency) - General (descriptive) |
| What are the different spatial data analysis operations? | 1. Queries 2. Measurement 3. Reclassification 4. Buffering 5. Map overlay 6. Spatial interpolation 7. Analysis of surfaces 8. Network analysis |
| What are queries? | - A simple procedure for asking specific questions of the data ASPATIAL - Questions about attributes of features e.g. Whats the land use class of this polygon?/ How many people live in this polygon older than 65? SPATIAL - Questions involving spatial location of features e.g. Which towns are east of London/ how many children live in 5km of the airport? |
| What is measurement as a spatial data analysis operation? | - A common requirement to measure distance or area (volume) - Implementation can be complex - Important effect of the data model (difference between vector/ raster) - Measurement of length involves a metric for determining distance from coordinates 1. Pythagorean metric: Straight- line distance between two points on a flat plane 2. Great Circle metric: Gives the shortest distance between two points on a spherical globe, given their latitudes and longitudes |
| What are the issues with vector length measurement and how can you take vector and raster measurements for area? | - Length of a true curve is almost always longer than the length of its polyline or polygon representation - Vector = decompose the vector polygon into simpler, smaller shapes and their areas are then summed - Raster = calculating the number of cells x cell width x cell height (Number of cells x area of 1 cell...) |
| What is meant by reclassification as a spatial data analysis operation? | - Creation of a new output layer based on values in the input layer (one layer in, one out) - Input: may be categorical or continuous - Output: Generally categorical (Implemented in ArcMap using - spatial analyst > reclass > reclassify) |
| What is meant by buffering as a spatial data analysis operation? | - Generate zones of specific width around existing features - Identify zones of interest (e.g. a region <500m from a main road/ houses >5km from a factory) (Implemented in ArcMap using - analysis > proximity > buffer) |
| What is meant by map overlay as a spatial data analysis operation? | - Integrating data from two (or more) separate layers to make one new layer (two or more layers in/ one layer out) - Vector/ raster very different - Map overlay in Vector GIS - e.g. point-in-polygon - Raster overlay - Corresponding cells in two layers are overplayed to obtain a new value (can be arithmetic (+,-,/,*) or logical (AND, OR, NOT, >, <) (Implemented in ArcMap using spatial analyst > map algebra > raster calculator) - A common raster overlay is the 'binary mask', used to include/ exclude regions - 'masks' of 0s (absent) and 1s (present) - powerful when used with multiply overlay |
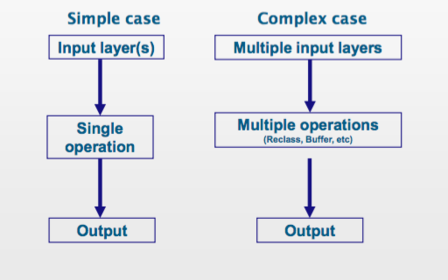
| What is meant by a cartographic model? | 1. Term coined to designate the process of using combinations of commands to answer questions about spatial phenomena (Demers, 1997) 2. A set of interacting, ordered map operations that act on raw data, as well as derived and intermediate map data to simulate a spatial decision making process (Tomlin, 1990) *Models give a logical, specific order, hierarchal structure to complex real- world problems that cannot be answered with a single GIS operation |
| What is the difference between simple and complex cases of cartographic modelling? | |
| What are local, focal, global and zonal operations in cartographic modelling? | LOCAL- Examine rasters cell by cell, comparing the value in each cell in one layer with the values in the same cell in another layer FOCAL - Compares the value in each cell with the values in it neighbouring cells GLOBAL - Produces results that are true of the entire layer (mean or sum) ZONAL - Computes operations for contiguous (neighbouring) blocks of cells (e.g. summing population in a region) |
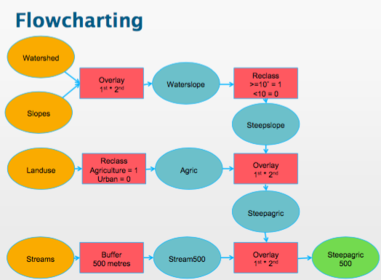
| What is flowcharting? | FLOWCHARTING - Integral to cartographic modelling - used to plan approach and communicate methodology 1. Start with question 2. Work backwards - data and operations (What data is needed/how will operations be implemented...?) |
| What are good practices for flowcharting? | 1. Show inputs and outputs (short and clear names) 2. Include parameters for operations (recalls values/ overlay parameters) 3. Make it flow (Clear structure, joined up and easy to follow 4. Pay attention to design and structure |
| What is the example for flowcharting? | |
| How was spatial data collected in the past? | - OS maps easiest maps to work with - simple and harmonious sets of colours - Country split into 200 different maps in the land ranger series - Used to be drawn by hand (1 years training) - Men in the field took the ground measurements |
| What are the 3 dimensions of spatial data? | 1. Spatial - where? 2. Thematic - what? 3. Temporal - when (what period does data covered)? Should all be displayed on the map... |
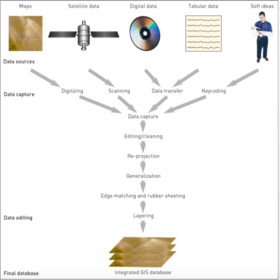
| How is data captured? | PRIMARY 1. Raster: - remotely sensed - satellite imagery, ariel photography and wireless sensors 2. Vector - land surveys, GPS SECONDRY - 1. Raster: Scanning 2. Vector: Digitising |
| How is data remotely sensed? | - Specify observation area from satellite data - Information used to apply imagery - satellite observations can be from not only physical section of spectrum, but of different wavelengths of bands - Can also look at change over time |
| How is data collected by remotely sensed with aerial photography? | - 'snapshot' of earth at a particular time (often ad hoc) - Usually cameras mounted on airplanes flying at low altitude - can be of high resolution -Can be expensive and limiting in the time of day - Useful for background/ contact or can be transformed into actual objects for use in analysis - Remote locations that are hard to access - High buildings can distort the picture |
| How are land surveys used as a primary data capture method? | - A primary vector data capture - Measures angle and distance from known points to establish a 3-D location - Is increasingly automated - Is time consuming and expensive, but accurate - 'total- station' tool combines optical angle and electronic distance measurements, also to create measurements from given co-ordinated -Lasers travel at a constant speed (speed of light) |
| How can GPS be used as a primary data capture method? | - Used in everyday life - Group of satellites orbiting earth - Uses a triangulation system to give distance away from all the satellites - Can then use to visualise trends in datasets (planes over cities) - tracks travel through space and knows how long for and what at speed |
| What is meant by scanning? | - Taking old maps and then scan in paper maps to make a digital copy or a raster fit version to use in GIS |
| How is secondary information digitised? | - When maps scanned in, can trace the boundaries etc. to manually click and digitise the outline features - Can then load items into GIS systems - Can be time consuming, and due to human intelligence (can be opportunity for error) |
| How is data converted? | 1. Change in the data model - Raster to vector = Vectorisation - Vector to raster = Rasterisation 2. Change in the feature type - Points to areas = aggregation |
| How are databases used as data storage? | - Databases important in GIS to store, organise, analyse and retrieve data - In tables - Columns (attributes to be stored (fields)) - Rows (values of attributes for each spatial feature) - Keys (the field/ attribute used to uniquely identify each feature, often used to join tables) - Relations (relationships/ links between tables/ records) |
| What is meant by a 'relational' database? | - Can join tables, where there is a matching and corresponding table (has extra description of the first column) |
| What is meant by Structured Query Language? (SQL)? | - Standard language for querying databases - Sets of logical expressions - Pseudo- English - Language style (Select land plots where owner = Smith/ Order by population etc.) - Can have an 'and' function - Relational joins - Many of the tasks are now menu/ wizard bases e.g. Microsoft Access |
| What is an aspatial and spatial query? | - Ask questions about 'where' - Asks questions about the attributes of the dataset (what) - GIS queries usually combine both types of queries |
| What is meant by analogue data/ computer data and geo- referencing? | Analogue data - Paper based Digital data - computer readable format data Geo-referencing - The process of linking items of attribute information into some spatial referencing system |
| What is the data stream? | |
| How can GIS be used to make decisions in the real world? | - Can solve complex problems and look at multiple angles - GIS is a software where input questions are the importance for what data comes out - Has to ask whether it is rational to map the data? - Need to think of the overall use of the data - the overall quality has to be good (especially the metadata) - Data to be accurate and up to date - Support systems are procedural approaches and should allow more effective decisions and can show the processes used to evaluate it |
| How is GIS used in Geology? | - In the 'gold rush' for rare Earth minerals - Looks at where resources may be, if they are accessible and are nearby stakeholders and governments going to cooperate? - Initial prospecting (aerial multispectral and hyper spectral imaging)/ surveys to locate test holes/ site surveys and construction surveying |
| What is meant by a Decision Support System (DSS)? | - Approach to the decision making process - A tool to support decision making in a scientific and logical way - Attempts to improve the effectiveness of decisions |
| What are the characteristics of DSS? | 1. The ability to tackle semi- structural problems 2. Relatively easy to use for a range of stakeholders 3. Allow solutions to problems to be developed based on current knowledge and data 4. Allow interaction between participants 5. Specific to one job |
| How do Spatial Decision Support Systems (SDSS) differ from Decision Support Systems (DSS)? | - Have similar characteristics, but can be used where the problem has an important spatial component - OR where there are geo- spatial datasets to support the decision |
| Who can be clients of GIS? | - Consulting firms - Service and utilities organisations and businesses - Government - Organisations needing to answer a geographic question.... - GIS is easy for stakeholders the use (some can be on the fence i.e. NIMBY or could bring jobs...) - Flow charts and good datasets are essential to reach the best aims for the most people |
| What is the case study for SDSS on nuclear waste disposal? | - Its a very sensitive issue - Requires a rational and scientific approach to justify final decisions - In the 1980s, UK government agency was responsible used a lot of maps by hand, but this meant it took a long time and some sites were missed |
| What was the flowchart for nuclear waste disposal SDSS? | 1. Identify relevant factors for the nuclear site 2. Collect and digitise data 3. Identify criteria and create GIS layers for each 4. Overlay 5. Analyse output |
| What are the key aspects of SDSS? | - People make the ultimate decision supported by analysis from SDSS - There is a combination of GIS with multi- criteria evidence |
| What is the importance of the data input? | - Input data has to be in shape file - When data is collected, has to look and what was used to collect it and not be ambiguous with the parameter inputs - Businesses could be run more effectively by answering geographic and spatial questions - Data should be described qualitvely as well as - The GIS human user component can be subjective in what they choose |
| What is meant by participatory decision making? | - Involves all stakeholders in the decision - Requires people who are very familiar knowledge of the software and have specialist knowledge - Users have to also be familiar with the SDSS principles |
| What is the case study for vulnerability mapping in SDSS? | - Mapping populations vulnerable to floods in India - There are limited government resources for protecting the population - Development needs to be targeted to those most likely to be affected - Vulnerability means different things to different people which creates a problem. All stakeholders have to be addressed |
| What can participatory methods cause? | CONFLICTING IDEAS - Can create different outputs reflecting different stakeholder issues and values - Use SDSS and participatory approaches to resolve the conflict - Things have to be displayed in GIS in quantiles (no advancement of quantitive data) - The overlaps are the most important areas as benefit the most |
| What are the strengths of SDSS? | 1. Tailored to individual problems - identifies priority areas quickly 2. Tackles un-structured or poorly structured problems 3. Encourages a logical and scientific approach 4. Based on current knowledge and data available 5. Efficient 6. Encourages public participation |
| What are the weaknesses of SDSS? | 1. Requires a lot of work and investment - requires a lot of time and money 2. Lacks functionality when publicly available - hard to measure the data quality when its not known who is inputting (give users a unique ID to show if its one or many people giving input) 3. Requires facilitators when functionality is increased - they are charged with stepping back and looking at the bigger picture 4. Hard to know when to stop an draw lines |
| What are the categories of GIS? | 1. DESKTOP GIS - On desktop computer (ArcMap) 2. DEVELOPER GIS - Collection of components that a programmer may use to build a bespoke application (ArcGIS Engine) 3. MOBILE GIS - ESRI ArcPad - designed for use within the field 4. WEB MAPPING/ SEVER GIS - Software and databases accessible online. Servers handles multiple requests from networked clients (ArcGIS Server) |
| What are the levels of operation for GIS? | - How GIS is applied in the context of an organisation 1. Operational Application - Day to day management of facilities and assets, monitoring at different time points across an entire network (electric company monitoring its infrastructure) 2. Management/ tactical applications - Use GIS to assist management decision making (where to site a new shop - gap in market) 3. Strategic Application - Use GIS to make longterm strategy decisions (which parts of country to expand over the next 5 years?) |
| How is GIS invested in? | - Much of the cost of GIS comes from data - This is reducing now with data available under the Open Data license - Initial investment is steeper, with some cost associated with maintaining the database, but makes for faster and more detailed analysis - Cost - benefit analysis comes from either between systems (paying others via consultancies) or the payback period (in years) |
| What are the direct and indirect benefits to GIS? | DIRECT 1. Savings - EIAs and surveys can be done in house 2. Increased effectiveness 3. Brand new products INDIRECT 1. Improved information sharing 2. Better informed decision making 3. Greater understanding - easier to visualise the data through mapping 4. Better justification 5. More competitive |
| What are the direct and indirect costs of GIS? | DIRECT 1. Hardware/ software - there's a reliability of computers in the network and the software 2. Data 3. Human and administrative costs INDIRECT 1. Increased reliance on computers 2. Higher skilled workforce |
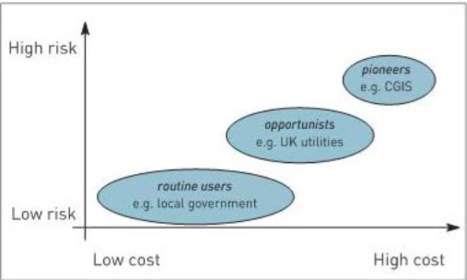
| What does the cost - benefit graph for user groups of GIS look like? | Investment in GIS applications brings some risk, there are 3 broad user groups, each with varied levels of cost and risk |
| What should be the questions when implementing GIS? | 1. Do you NEED GIS to answer the research question? 2. How will your audience use the outputs? 3. Can you make the results more accessible? |
| How is a GIS project planned? | 1. What is the question you want to answer? 2. What has already been done (lit review)? 3. Which spatial data model is most suitable? 4. What data is available? Are they timely? 5. Plan your analysis 6. Write up what you did, the results and how it compares with the previous work |
| Why does error within GIS matter? | - GIS analysis relies on quality data, but also sensible technicians who can identify inaccuracies and the source of error - Error can render the analysis useless, meaningless or cause inappropriate decisions to be made based on faulty outputs - Bringing together diverse datasets and create more chances for error to be introduced |
| Where can error and uncertainty come from in GIS? | 1. Data models 2. Computer structure 3. GIS input - both in data acquisition and storage and editing 4. Spatial analysis - query and description, measurement, classification, statistical surfaces, spatial arrangement, map overlay and modelling. Have to be careful of decimal places in data editing *One error in analysis will tend to propagate through the rest of the results, but errors are inherent in data - have to be careful of data source and reliability |
| What is meant by error? | - In everyday language it means a mistake - In quantitative science it means the difference between a predicted or measured value and the true value |
| What does a kappa score do? | Size of the data set is important Looks at the coherence between the questions asked |
| Why is GIS prone to error? | - GIS is a model of reality - There will always be error and uncertainty in maps - Chloropleth maps are blocky - Interpolations in themselves are inherently uncertain - It is important to also look back at the metadata - Looking at quantiles rather than absolute scores is important - data going in needs to be of quality and done by people who know what they're doing - the means of data collection is important |
| How is data acquisition a possible source of data error and what are the examples of this? | - Limiting digitising error when digitising maps needs specific conditions 1. Air conditioned room 2. Materials at room temp 3. Drafting tape - not as sticky 4. Flatten document 5. Maintain the temp if doing it in multiple session Even so, 1mm of a 1:50000 map = 50m error |
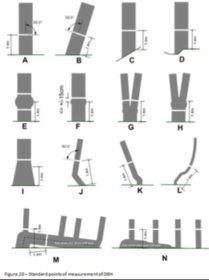
| How is measurement a possible source of data error and what is the example of this? | - Field data can be less accurate if measurements are taken with human error e.g. measuring tree girth |
| How is geographic transformation a possible model source error? | - Measurements have to be calibrated against each other - Sometimes data can be in more than one projection |
| How is geographic regression prediction a possible source of model error? | - Data going into a regression model can effect the outgoing data |
| What is uncertainty? | - If you are unaware of the error, this can be uncertainty (errors are the known unknown) - Uncertainty shows the magnitude of errors - The closeness of output to reality is unknown, therefore errors introduce uncertainty into outputs (maps, stats etc.) - The combination of recognising error and uncertainty within GIS analysis will give some idea of accuracy |
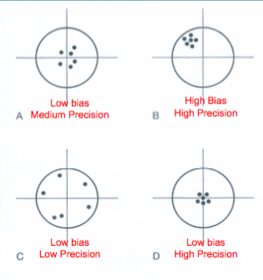
| What is meant by accuracy, precision and bias? | ACCURACY - The extent to which an estimated data value represents the true value. Accuracy has to be of low bias and high precision PRECISION - The dispersion of a measured or predicted value (also need to specify decimal places...) BIAS - Any systematic difference between the true value and the measured or predicted value (e.g. overprediction) |
| How can bias and precision be mapped? | |
| What are the three types of accuracy in GIS? | 1. Positional - are features in the right place? 2. Attribute - Do features have the correct value? Continuous and categorical (postcodes only accurate to around 18 dress points, but could be 100sm apart in rural areas) 3. Topological - Do features relate to each other correctly? |
| Where are there sources of error and uncertainty in GIS? | 1. Data collection 2. Data encoding - how data is represented, importance of scale (right number of decimals) 3. Data editing/ conversion 4. Data analysis 5. Data output |
| What are the sources of error within data analysis? | 1. Query and description 2. Measurement - vector to raster data has to be very thought through 3. Classification - in quantiles/ deciles etc. 4. Statistical surfaces - vernal density/ inverse distance weighted (have to choose how good things are for the data) 5. Spatial arrangement 6. Map overlay 7. Modelling |
| What are the common errors in GIS? | - Misalignment errors in the overall - Aggregation/ disaggregation - Classification (especially of continuous to categorical data) - Errors that propagate through - strange results have to be questioned - flow charts can document each stage so it is easier to go back to the previous step - Error checking and validation of the data sets is important |
| how is what3words a form of geovisulaisaiton? | - Claim 75% of the world has poor addressing - Divided the globe into 57trillion 3mx3m squares - Assigned a 3 word sequence to every square as an address - quick to remember and easier to communicate |
| What are important to include on a traditional map? | 1. grid reference 2. Map body 3. Title 4. North arrow 5. Legend - important to look at 6. Scale 7. Insert map - larger geographic area draws the eye 8. Map metadata 9. Copyright acknowledgement |
| What has to be considered in map design? | 1. Purpose/ agenda - what will be mapped and what the target audience is 2. Representing reality - projection/ spatial referencing/ features and data types/ scales/ generalisation/ symbology/ annotation |
| What practical considerations should there be for map design? | - Available data - Orientation/ shape of country to determine layout - Conditions of use (map used indoors or outdoors?) - Technical limits (maps displayed in a web browser) |
| What limitations are there with chloropleth mapping and how is this mitigated? | - Larger geographic area draws the eye, but the densities may not represent the true value CARTOGRAMS then used - Ignore geographic area and concentrate on other views - Use thematic variables as a substitute for land area/ distance |
| What is a cartogram? | - A map in which at least one aspect of scale, such as distance or area is deliberately distorted to be proportional to a variable of interest - Relative values of objects on a map are reflected on the size of the area - Easier to access compared to trying to translate shades of colour into rates and imagine the implications - Improves visual communication - Needs to be distorted per person in space |
| What is the sensory homunculus? | - Used in medicine to show the human body in degrees of sensitivity - the skin is rescaled in proportion to the number of nerve endings (hands and mouth really big) |
| What types of cartograms are there? | Non- contiguous - areas can overlap. Boarders to move with flow and allows the area to be distorted Contiguous - maintains borders, but is harder to distort. Effectively bar charts |
| What have been the advancements in human cartography? | - Manual drawing and manipulation of hundred of cardboard tiles to early computer algorithms to computer algorithms - If distortions are too large on the cartogram, they can now be animated to see the boundaries - boarders moving with the 'flow' of people developed by Newman and Gastner in 2004 |
| How does Newman and Gastners technique work? | 1. People are unevenly distributed (as seen in real life) 2. To create the cartogram, people are diffused to give an equal spread of the population 3. As they diffuse, boarders 'drag' with them 4. Spatial units then have an equal population density 5. People depicted might represent the entire population, unemployed, just females, the elderly etc. |
| How is 3D visualisation, animation and argumented reality being used? | - More natural or realistic visualisation of spatial data - Can place you in the environment (used for stakeholder feedback and consultation in urban planning) - Animation is useful for temporal changes - Interaction with the data allows variables to be further explored and may allow for other trends and patterns to be found |
| How is 3D geovisualisation being used? | - Advances in computing power, data avaibility and open source software used to make developments in geovisualisation - 3D maps allow height to represent the data |
| What is the importance of flow mapping? | - Can show lots of movements, possible to show flight paths - Looks at origin and destination data projection - Used for an army mission in the Napoleonic war...! |
| What is the importance of online maps? | - Online interactive maps make it easy to find a specific area - Google fusion tables are useful and can use information off spreadsheets |
| What are schematic maps? | - Transit maps (tube/ rail/ motorway) - Utilities |
0 comments
Want to create your own Flashcards for free with GoConqr? Learn more.