7137429
Description
Flashcards by Khaya Bhebhe, updated more than 1 year ago
|
|
Created by Khaya Bhebhe
about 9 years ago
|
|
| Question | Answer |
| Maths GCSE : 1-9 | jhujji |
| Data | Frequency tables Cumulative Frequency Box Plots Histograms |
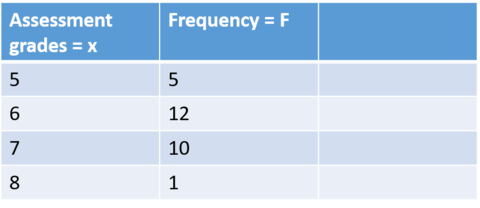
| Frequency Tables: averages from a frequency table | You can find all the averages and Range from a frequency table. Remind are self what the averages are: Mean: add them all together and divide by how much data Median: The middle data once in order of size n+1 x 1/2 Mode: the most common data Range; the highest data - the lowest data |
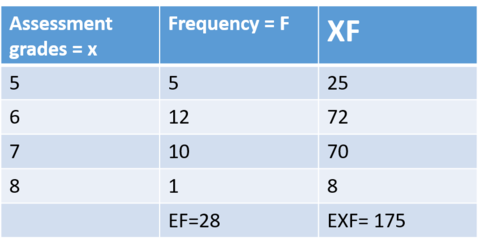
| Examples of averages from a frequency table: Find all the averages (and Range) | Mean: 175/28= 6.25 Median: 6//n=( 28+1 x 1/2 = 14.5position) Mode: 6 Range:3 |
| If there is a group answer e.g O<m<5 what do you have to do | Before anything you have to add a MIV (MID-interval value) and then do MIVxF column instead of a FX |
Want to create your own Flashcards for free with GoConqr? Learn more.