7598266
| Question | Answer |
| What does a P wave represent? | Atrial depolarization. It's duration correlates with conduction time through the atria. Axis points toward lead II. It is upright and most positive in lead II, downward in aVR, and smallest in aVL. The electrical vector is directed from the SA to AV node and spread from RA to LA. If see a bimodal P wave, may indicate pathology in one of the atria (the taller hump). Normal is <.12 |
| What does the PR interval represent? | The time from atrial depolarization to ventricular depolarization, corresponding to AV node conduction. Normal is < .20 (1 big block) The time it takes for the impulse to travel from the SA node to the AV node and into the ventricles. It is a good estimate of AV function. |
| What does the QRS complex represent? | Ventricular depolarization. Ventricles depolarize in all different directions. First the intraventricular septum depolarizes, with LV before RV. The QRS interval is normally between .08 and .12 sec. The apex then depolarizes resulting in an rS wave in V1 & qR in V6 If it is wide there is conduction deficite, hypertrophy, or an impulse generated from the ventricles. |
| What does the T wave represent? | Ventricular repolarization. Normal shape is asymmetrical with a gradual upslope and an abrupt downslope. The direction of the t wave should follow the QRS complex. The T wave is positive in lead II and negative in aVR. If the T wave is positive in any chest lead, it should be positive in all chest leads to the left. It is usually <5mm in extremity leads and <10mm in chest. |
| What does the QT interval represent? | The duration of ventricular repolarization. Varies with HR (slower HR --> increased QT) Normally <.45sec and <50% of RR interval. |
| What is the J point? | The junction at the end of the QRS complex and the beginning of the T wave. |
| What does a J wave represent? | A late wave seen pathologically (hypothermia or hypercalcemia) that follows the QRS complex or a small R wave. |
| What does a U wave represent? | The last part of ventricular depolarization. It's significance is unknown, but it appears in hypokalemia, hypocalcemia, and hyperthyroidism. |
| What are methods fro measuring the heart rate on an ECG? | Find an R wave on a thick line and locate the next R wave, then: 1. 300/# of large boxes between R waves 2. 500/# of small boxes between R waves 3. 300, 150, 100, 75, 60, 50 |
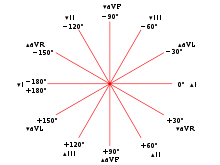
| Lead I | LA+ --> RA- This shows the LA voltage minus the RA voltage and looks at the lateral heart. The angle of orientation is 0 |
| Lead II | LL+ --> RA- This shows the LL voltage minus the RA voltage and looks at the inferior heart. The angle of orientation is 60. |
| Lead III | LL+ --> LA- This shows the LL voltage minus the LA voltage and looks at the inferior heart. The angle of orientation is 120. |
| Which are the bipolar leads and what do they represent? | Leads I, II and III are bipolar leads since the electrical voltage recorded by them is the difference in voltage between two leads. Together they make up Einthoven's Triangle. The center of the triangle is the heart's electrical center (AV node). I + III = II |
| Which are the unipolar leads and what do they represent? | Leads aVR, aVL, and aVF are unipolar leads that record the voltage at one location relative to 0. They record the difference of potential between a positive extremity and the electrical center of the heart. Names of the leads are determined by the positive pole. The sum of these three leads in 0. |
| Lead aVR | RA is + The electrical activity of the heart moves away from this lead. Waveform is usually negative. The angle of orientation is -150. |
| Lead aVL | LA is + This looks at the lateral heart. The angle of orientation is -30 |
| Lead aVF | LL is + This looks at the inferior heart The angle of orientation is 90 |
| Precordial leads | *Used to view the heart on a transverse/horizontal plane. *They measure electrical potentials moving anterior to posterior not L to R or up to down. |
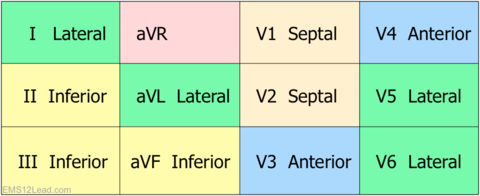
| V1 | 4th intercostal space, right sternal border. Septal |
| V2 | 4th intercostal space, left sternal border Septal |
| V3 | Midway between V2 and V4 Anterior |
| V4 | 5th intercostal space, mid-clavicular line Anterior |
| V5 | 5th intercostal space, left anterior axillary line Lateral |
| V6 | 5th intercostal space, left mid-axillary line. Lateral |
| Limb Leads Chart What part of the heart does each represent? | |
| The three laws of electrocardiography | Law 1: Depolarization that approaches a surface electrode records a positive deflection. Law 2: Depolarization that moves away from a surface electrode records a negative deflection. Law 3: Depolarization that is perpendicular to an electrode records an equiphasic deflection. |
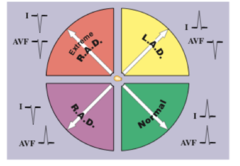
| Measuring the axis (quick version) | Look at leads I and aVF and use chart to determine. Ex: Lean 1 and aVF both + then normal QRS deflection. |
| Measuring the axis (long version) | *Find the extremity lead with an equiphasic QRS complex *Look at the lead 90 degrees away. The direction of this lead gives the location of the axis. |
| Vector change from neonate to adulthood | As the neonate grows the mean QRS vector rotates from the right anterior (due to RV dominance) to 90 degrees as an infant and leftward and posteriorly in adolescents/adults. |
| Normal sinus rhythm | Refers to signal generated by the SA node that is 60-100bpm and every p wave is followed by a QRS complex and usually a T wave. |
| Arrhythmias, generally | An arrhythmia is a disturbance in rate, regularity, site of origin, or conduction of impulses. It is best to find these on Lead II |
| Sinus bradycardia | Normal sinus rhythm with a rate <60bpm Etiologies *Normal variant: athlete *Drugs: β blockers, Ca Channel Blockers *Increased vagal tone *Carotid massage *Hypothyroidism *Hypothermia *Hyperkalemia *Inferior wall MI *Sick sinus syndrome |
| Sinus tachycardia | Normal sinus rhythm with a rate >100bpm Etiologies *Anxiety *Fever (1 degree temp increase = 10bpm increase), infection, sepsis *Drugs: cocaine, epinephrine, TCA, atropine, anticholinergic, anti-cholinergics, dopamine) *CHF *PE *Acute MI *Hyperthyroid *Volume loss: trauma, dehydration, vomiting, diarrhea *Alcohol intoxication or withdrawal |
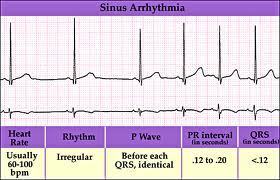
| Sinus arrhythmia | Sinus rhythm between 60-100bpm, but varies with respiration. Inspiration will accelerate HR and exhalation will decrease HR. |
| ECG and Cardiac Enlargement | *ECG wave may increase in duration due to the chamber taking longer to depolarize *ECG wave may increase in amplitude due to the chamber generating more currant/voltage. *ECG axis is shifted due to a larger percentage of the electrical current moving through the enlarged chamber. |
| How do you assess left atrial abnormality/enlargement on an ECG? | Look at lead II and V1. in V1, LA depolarization will dominate due to larger size. This results in a wide, deep, asymmetric P wave. The terminal portion of this wave has width and depth greater than 1 small box. In lead II get a prolonged P wave which may be notched (2nd hump larger) Not all biphasic p waves in VI are LAA Causes: Left-sided valve disease (mitral stenosis, insufficiency, hypertensive HD, cardiomyopathy, CAD |
| How do you assess right atrial abnormality/enlargement in an ECG. | Look at lead II and V1 *In V1, RA depolarization will dominate creating a biphasic P wave (1st portion is tall >2mm). Rare to see. *In lead II there will be a tall P wave >2.5mm. It is not prolonged. *Causes: Lung disease, COPD, PE, Congentital HD (pulmonic stenosis, ASD, tetralogy of fallot, ebstein's anomaly), usually see RVH. |
| How do you assess for ventricular hypertrophy on an ECG? | Look at the QRS in V1 and V6 *QRS will be wider (takes longer for depolarization to spread) or greater magnitude (increased voltage generated from increased mass) than normal. |
| How do you assess for left ventricular hypertrophy on ECG? | The criteria are: R(V5 or V6) + S(V1) >= 35 R(aVL) > 11-13 R(I) + S(III) >= 25 R(V5 or V6) >= 25 Largest R wave + deepest S wave >= 45 A strain pattern (not true ST depression) is seen in leads with tall R waves (V5, V6) Causes: Left sided valvular disease (AS, AI, MI), Systemic HTN, dilated cardiomyopathy |
| How do you assess for right ventricular hypertrophy on ECG? | The criteria are: Height of R > Depth of S in V1 (usually also deep S in lateral leads) R(VI) >= 7mm R (III) > R (II) (RAD) A strain pattern in the right chest leads Causes: Lung disease, COPD, PE, Congentital HD (pulmonic stenosis, ASD, tetrolagy of fallot), mitral stenosis |
| What is a bundle branch block? | Normally, both LV and RV are depolarized at the simultaneously (in less than 3 little boxes). In a bundle branch block, the ventricles depolarize in a series (first one, then the other). On an ECG this will result in an altered QRS morphology, widening of the QRS complex, changes in the ST segment and/or T wave. |
| How do you assess a right bundle branch block on ECG? | A RBBB will delay right ventricular depolarization. The septum depolarizes normally. Since the LV is electically predominant normally, the QRS will initially appear normal. Following completion of LV depolarization, the RV depolarizes and the electrical current is directed to the right adding a third phase to the QRS. The criteria: *rSR' in V1 *Wide S in V6 *Wide QRS, > .12 must be present Causes: Normal variant, MI/ischemia, right heart disease, (COPD, PE, pulm HTN, pulm valve stenosis), CABG, chronic degeneration of conduction system. |
| How do you assess for a left bundle branch block on ECG? | A LBBB will cause the septum to depolarize from right to left resulting in the loss of normal septal waves from V1 and V6. As the depolarization spreads, the voltage in the LV is still greater than the RV so the entire process of ventricular depolarization will be oriented toward the left chest leads. The criteria: *qS in V1 (maybe notched W appearance) *Notched M appearance in V6 (bunny ears) *T wave inversion in the left precordial leads *No septal Q waves *Wide QRS (>.12) must be present KEY: New LBBB in presence of acute MI may lead to complete heart block **Once you find a LBBB you cannot interpret anything to the left of the block on the ECG Causes: Usually a sign of organic HD, Valve disease (AI, AS), Hypertensive HD, CAD, cardiomyopathies. |
| How do you assess for a left hemiblock on ECG? | A hemiblock refers to a block in either the anterior or posterior left bundle branch fascicle. The criteria are: *Left anterior hemiblock: Normal QRS, normal ST, left axis deviation, and no other cause for the deviation such as hypertrophy. *Left posterior hemiblock: Normal QRS, normal ST, right axis deviation, and no other cause for deviation such as hypertrophy. |
| What are the findings on ECG for transmural ischemia? | *Abnormal Q waves, ST segment elevation (usually 1st change), inverted T waves. *ST elevation can have variable shapes and may be accompanied by tall, peaked, hyperacute T waves. *Eventually over hours or days, the ST segments move back towards baseline and then the T waves invert in the same leads. Transmural ischemia can lead to necrosis of the muscle tissue and cell death if not recognized early. |
| What is the time course of an MI as it appears on an ECG? | Normal Hyperacute T waves (minutes to hours) ST elevation (0-12 hours) Q wave developing (1-12 hours) ST elevation with T wave inversion (2-5dys) T wave recovery (weeks to months) |
| How do you identify the location of an MI on an ECG? | *ECG leads overlaying the area of infarct will show the changes in time course of MI *There may be changes that occur in the leads overlaying the portion of the myocardium opposite the MI called reciprocal changes. Ex: ST elevation in leads II, III, and aVF (inferior) may result in reciprocal changes in ST in leads opposite (V1-V6, I, and aVL) *Because there are no leads directly over the posterior wall, posterior MIs can only be diagnosed by looking at reciprocal changes (usually in V1). Difficult to diagnose and often show signs of anterior or lateral ischemia. |
| Subendocardial infarcts | *The subendocardium is at greatest risk for ischemia because it is furthest from the blood supply and against eh ventricle with higher pressure. KEY: In a subendocardial infarction, the current is directed inward leading to S segment depression. There are no Q waves, but may still see T wave inversion which usually returns to baseline. *The lead patter with which changes occur can vary. |
| SUMMARY Affected area EKG leads Artery involved Reciprocal changes | *Inferior wall: II, III, aVF: RCA: I, aVL *Lateral wall: V5, V6: Circumflex: V1, V2 *Posterior wall: --: RCA, Circumflex: V1, V2 *Anterior wall: V1-V4: LCA: II, III, aVF *Apical: V3-V6: LAD: None *Anterolateral: I, aVL, V5, V6: LAD, circumflex: II, III, aVF *Anteroseptal: V1-V3: LCA: None |
| Wolf-Parkinson-White Syndrome (WPW) | *Short PR interval < .12: signal travels faster to the ventricles through the accessory pathway (Bundle of Kent) *Wide QRS > .12: ventricles take longer to depolarize because the signal does not follow the bundle branches *Delta wave: slower upstroke of QRS |
| Approach to identifying arrhythmias | 1. Is the QRS normal in appearance? If not, thing Vfib, Vtach, asystole) 2. Is there a P wave? If not, think Afib 3. What is the relationship between the P wave and the QRS? (Heart block) |
| Ventricular fibrillation | *Most important rhythm to id because the most common mechanism of arrest resulting from ischemia or MI. *In Vfib, multiple areas in the ventricle are depolarizing and repolarizing at the same time. There is no organization resulting in no cardiac output. *ECG findings include: No normal QRS, Rapid rate (too disorganized to count), No pattern to the rhythm, |
| Ventricular tachycardia | *Three or more beats of ventricular origin (PVCs) in succession with a rate > 100bpm. It may be well tolerated or associated with hemodynamic compromise based on the presence of an MI or rate of Vtach. Signs/Symptoms: CP, SOB, low BP, shock, pulmonary congestion, CHF, MI, decreased consciousness. ECG: No normal QRSs (wide), 3 or more beats of ventricular origin > 100bpm, Regular rhythm. |
| Ventricular asystole | *Refers to total absence of ventricular activity. *W/o ventricular depolarization, there is no ventricular contraction (P wave may occur, but there will be no pulse) *Vfib can masquerade as asystole so always check in two leads. *Meds to generate electrical current before shock. |
| Premature ventricular contractions (PVCs) | *Caused by depolarization of the ventricle before the next sinus beat. Instead of the two ventricles depolarizing together, they depolarize sequentially and conduction occurs more slowly. *ECG: Wide, bizarre QRS complexes interspersed between normal beats, ST segment and T wave in opposite direction of QRS. *KEY: 3 or more PVCs in a row defines Vtach *There are two types of PVCs uniform/unifocal (have constant morphology and arise from the same aberrant foci) and multifocal (have variable morphology and arise from different aberrant foci) |
| Pulseless Electrical Activity (PEA) | Refers to normal looking QRS without a pulse. Indicates the presence of some type of electrical activity other than Vfib or Vtach |
| Atrial Fibrillation | Rhythm resulting from multiple areas of reentry within the atria or multiple ectopic foci that create unorganized, very rapid electrical signals. *Each electrical impulse results in a depolarization of a small portion of the atria rather than the whole atria meaning that the atria never contract as a whole. The transmission of a given atrial impulse to the AV node is random. *ECG: No P waves, fibrillatory pattern between QRS complexes, Irregularly irregular rhythm (RR intervals vary because you never know when an impulse will be conducted through the AV node), Normal QRS *The atrial rate is between 400-700 but is too fast to be counted. The ventricular rate is 10-180. |
| Atrial Flutter | *Rhythm resulting from a reentry circuit within the atria *ECG: Sawtooth P waves (II, III, aVF), regular atrial rhythm (RR interval does not vary), Normal QRS. *The atrial rate is usually 300 (220-350) with a 2:1 block making the ventricular rate around 150. |
| AV Block, generally | In a normal ECG, every QRS is preceded by a P wave and every P wave has a QRS and the PR interval does not exceed .20. AV (Heart) Block occurs when there is a delay or interruption of conduction through the AV node between the atria and the ventricles. There are three degrees of heart block. |
| First Degree AV Heart Block | *Involves a delayed passage of the signal to the ventricles from the atria. *It is usually benign and often treatment is not needed *ECG: Prolonged PR interval > .20 |
| Second Degree AV Heart Block Mobitz Type I | *Decreased conduction velocity occurs through the AV node until an impulse is eventually completely blocked. *Usually due to increased parasympathetic tone or drug effect. *ECG: ElongatING PR until a beat is skipped, Regular atrial rate/rhythm, Irregular ventricular rate/rhythm, Normal QRS |
| Second Degree AV Heart Block Mobitz Type II | *Where there is a random skipped beat without PR interval lengthening before the skipped beat. (Multiple non-conducted beats can occur in a row) *Cause: organic lesion in the conduction pathway below the AV node. *ECG: Constant PR interval, intermittent skipped beats, might be normal or prolonged, Atrial rate/rhythm is regular, Ventricular rate/rhythm is irregular, Normal or wide QRS (normal if block occurs at bundle of His) *KEY: This can develop into complete heart block, Mobitz I cannot. |
| Third Degree Heart Block | *Complete absence of conduction between the atria and the ventricles causing them to fire independently of each other. *ECG: Normal P wave, Atrial rate > ventricular rate but both are regular, PR interval varies, QRS may be normal (if impulse initiated above bundle branch or abnormal if the block occurs below the bundle branch) |
| Hypokalemia | Refers to low blood K+ (normal 3.5-5.5) ECG Findings: *U wave usually of smaller amplitude than T wave *Flattened T wave *ST depression: s/t can mimic ischemia |
| Hyperkalemia | High blood K+ that can cause life threatening arrhythmia ECG findings (depend on K+ level) *Peaked T waves in precordial leads *Shortened QT interval (s/t ST depression *Widening of QRS if K+ > 6.5 *Sine wave pattern (no P waves): can be fatal rhythm (Vtach/Vfib) |
| Hypercalcemia | High blood Ca++ ECG Findings: *Short QT interval *Short ST segment *J waves (Osborne waves) |
| Hypocalcemia | Low blood Ca++ ECG Findings: *Long QT interval *Lon ST segment |
| What can cause a prolonged QT interval? | *Drugs: Type IA (quinidine, procainamide, dysopyramide) or Type III (amiodarone, sotolol, dofetilide) antiarrhythmic agents. *Electrolyte: hypokalemia, hypomagnesemia, hypocalcemia *CNS Catastrophes: Stroke, seizure, coma, intracerebral/brainstem bleeding |
| Cardiac glycosides (Digoxin) and contractility | *Used to increase heart contractility in HF *Digoxin inhibits NA/K ATPase --> increased intracellular Na+ --> altered gradient that is required to drive the Na/Ca exchanger and less Ca is pumped out b/c there is a lower driving force for Na to move in --> increased intracellular Ca leads to increased contractility. |
| Digoxin side effects and their causes | *SE: Arrhythmia (slow AV conduction), anorexia, N/V, HA, alteration in color perception, increased toxicity with hypokalemia, hypothyroidism, quinidine, verapamil, amiodarone, renal failure. *Causes: Shortening of the atrial and ventricular refractory periods leads to short QT interval and repolarization abnormalities affecting ST, T and U. Slow AV conduction --> prolonged PR |
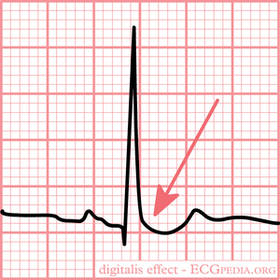
| Digoxin and ECG | *Salvadore Dali's Mustache: Sagging ST depression *Flat, inverted or biphasic T waves *PR prolongation (up to .24) *U waves |
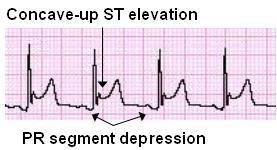
| Acute pericarditis | ECG Findings: *Diffuse (almost every lead) ST elevation w/ upright T wave (differentiate from AMI) *PR depression *Low amplitude/voltage QRS *Common with Afib/Aflutter |
| Cor pulmonale | ECG findings: *Rightward shift of P wave axis: Prominent P wave in inferior leads, but flattened or inverted in I and aVL *RAD *Low voltage QRS (due to barrel chest in COPD) *SV1-SV2-SV3 pattern: No R waves in V1-3 *RAE and RVH |
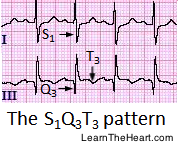
| Pulmonary Embolism | ECG findings: *Sinus tachycardia *S1-Q3-T3 pattern: due to right heart strain (S wave in lead I, Q wave in lead III, T wave in lead III) |
| Pacemaker cells | Collection of cells that can generate thei rown action potential (automaticity) and can depolarize repeatedly at a given rate (SA node, AV node, Bundle of His, Purkinje Fibers). Ex: The SA node fires at 60-100bpm. If the SA node is depressed, other pacemakers will compete to stimulate the heart contraction. |
| Electrical Conduction Cells | Long thin cells that make up the electrical wiring and carry the stimulus from the atria to the AV node then, to the ventricles. he Bundle of His divides into the LBB wchich further divides into a left anterior and left posterior fascicle. The Purkinje Fibers deliver the stimulus to the muscle. |
| Myocardial Cells | Contraction/relaxation of cardiac muscle. |
Want to create your own Flashcards for free with GoConqr? Learn more.