31333970
Description
Mind Map by Valentina ATHIA ESCALANTE, updated more than 1 year ago
|
|
Created by Valentina ATHIA ESCALANTE
almost 5 years ago
|
|
Business Statistics
- Business statistics takes the data analysis tools from
elementary statistics and applies them to business
- Many of the tools used in business statistics
are built on ones you’ve probably already come
across in basic math: mean, mode and median,
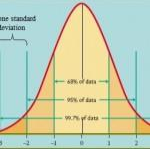
bar graphs and the bell curve, and basic
probability. Hypothesis testing (where you test
out an idea) and regression analysis (fitting
data to an equation) builds on this foundation.
- Describing Populations and Samples
- Is called Descriptive Statistics the process of
describing populations and samples
- Measure of central tendency
- where the bulk of the data lies. It
includes finding the mean, mode and
median.
- the formula is
- x̄ = (Σ xi) / n Population mean:
μ = (Σ * X) / N. They are solved
in the same way: add the
items together and then
divide by the number of items
in the set.
- x̄ = (Σ xi) / n Population mean:
μ = (Σ * X) / N. They are solved
in the same way: add the
items together and then
divide by the number of items
in the set.
- the formula is
- where the bulk of the data lies. It
includes finding the mean, mode and
median.
- Measures of dispersion
- How much is your data set spread out
around the mean? Is there a big difference
between your highest and lowest values?
Can be answered by finding the
interquartile range, variance and standard
deviation.
- The interquartile range is
especially useful if you are
more interested in where
the bulk of your data lies
and less interested in
extreme values.
- The interquartile range is
especially useful if you are
more interested in where
the bulk of your data lies
and less interested in
extreme values.
- How much is your data set spread out
around the mean? Is there a big difference
between your highest and lowest values?
Can be answered by finding the
interquartile range, variance and standard
deviation.
- Measures of Association
- Informs you about trends in data.
This might show a high or low
connection (“correlation”) between
different factors and final cost.
- Example
- If the price of tomatoes
goes up, it directly
affects the price of
ketchup.
- If the price of tomatoes
goes up, it directly
affects the price of
ketchup.
- Example
- Informs you about trends in data.
This might show a high or low
connection (“correlation”) between
different factors and final cost.
- Measure of central tendency
- Is called Descriptive Statistics the process of
describing populations and samples
- Probabilities and Random Variables
- Probability is the
foundation of
business statistics.
- the basic formula is
- P(A) = number of outcomes that give A / number of possible outcomes = r / n
- P(A) = number of outcomes that give A / number of possible outcomes = r / n
- There are dozens of ways to figure
out probabilities. It largely
depends on what you want to
know. For example, something
happening or not happening,
choosing people or items.
- In algebra, “x” or “y” can
represent a number, like
3,14,or 22.5. In statistics, a
random variable must be
linked to a random event or
experiment.
- In algebra, “x” or “y” can
represent a number, like
3,14,or 22.5. In statistics, a
random variable must be
linked to a random event or
experiment.
- the basic formula is
- Probability is the
foundation of
business statistics.
- Probability Distributions
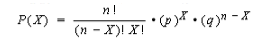
- Discrete Distributions
- Includes the binomial
distribution. In a binomial
experiment, there are only
two outcomes (such as yes /
no or success / failure).
- The formula is
- The formula is
- Includes the binomial
distribution. In a binomial
experiment, there are only
two outcomes (such as yes /
no or success / failure).
- Continuous probability distributions
- Can take on an infinite number of different values.
- Can take on an infinite number of different values.
- Discrete Distributions
- Describing Populations and Samples
- Many of the tools used in business statistics
are built on ones you’ve probably already come
across in basic math: mean, mode and median,
bar graphs and the bell curve, and basic
probability. Hypothesis testing (where you test
out an idea) and regression analysis (fitting
data to an equation) builds on this foundation.
Media attachments
Want to create your own Mind Maps for free with GoConqr? Learn more.