38197049
Description
Mind Map by Isabel bernard, updated more than 1 year ago
|
|
Created by Isabel bernard
about 3 years ago
|
|
Statistical Measures Bivariate of
regression and correlation
- Correlation
- It tries to establish the relationship or dependence that
exists between the two variables involved in a
two-dimensional distribution. That is, to determine
whether changes in one of the variables influence the
changes in the other. If this is happens, we will say that the
variables are correlated or that there is a correlation
between them.Martínez, C. (2011). Capítulo 2.
- TYPES OF
CORRELATION
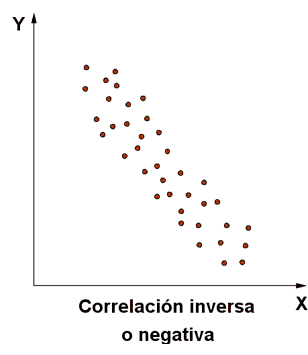
- 2° inverse correlation: the inverse
correlation occurs when increase
one of the variables the other
decreases. The line corresponding
to the cloud of points of the
distribution is a line decreasing.
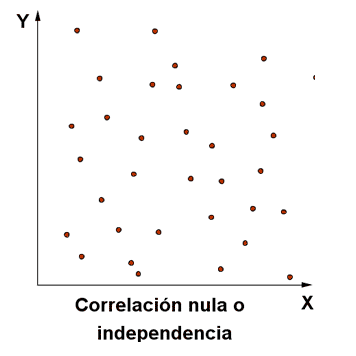
- 3º Null correlation: the null correlation
occurs when there is no dependency
of any kind between the variables. In
this case, the variables are said to be
uncorrelated and the point cloud has
a Round shape.
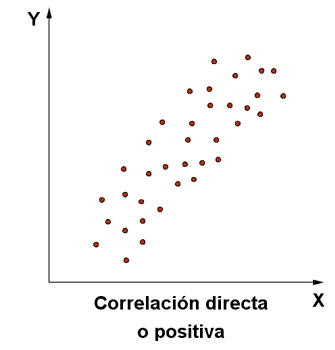
- 1º Direct correlation: direct correlation
occurs when increase one of the
variables the other increases. The line
corresponding to the cloud of points of
the distribution is a line growing.
- 2° inverse correlation: the inverse
correlation occurs when increase
one of the variables the other
decreases. The line corresponding
to the cloud of points of the
distribution is a line decreasing.
- DEGREES OF
CORRELATION
- 3. Null correlation: there is NO
pattern or relationship between
them
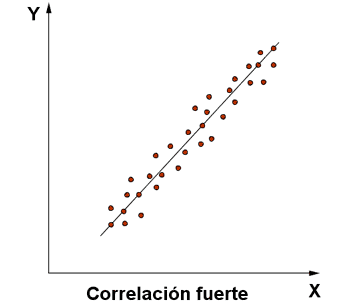
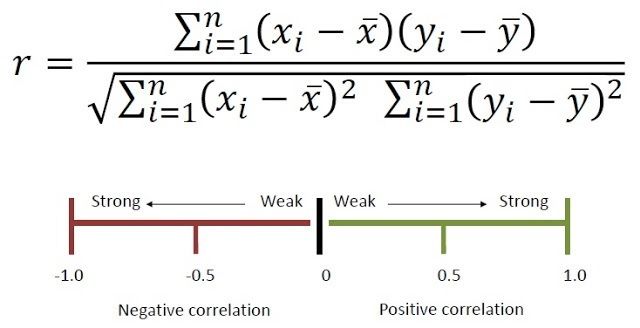
- 1. Strong correlation: the correlation
will be strong the closer are the
points of the line.
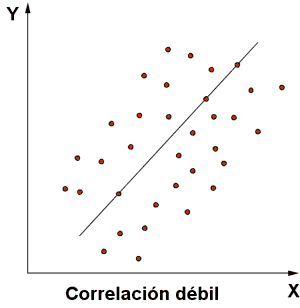
- 2. Weak correlation: the correlation
will be weak the more apart are the
points on the line.
- 3. Null correlation: there is NO
pattern or relationship between
them
- LINEAR CORRELATION
COEFFICIENT
- The linear correlation coefficient is the ratio
between the covariance and the product of the
deviations typical of both variables. The linear
correlation coefficient is expressed by letter r.
- The linear correlation coefficient is the ratio
between the covariance and the product of the
deviations typical of both variables. The linear
correlation coefficient is expressed by letter r.
- TYPES OF
CORRELATION
- It tries to establish the relationship or dependence that
exists between the two variables involved in a
two-dimensional distribution. That is, to determine
whether changes in one of the variables influence the
changes in the other. If this is happens, we will say that the
variables are correlated or that there is a correlation
between them.Martínez, C. (2011). Capítulo 2.
- Regression
- The regression line is the one that best fits the point cloud. The
regression line passes through center of gravity point called
center of gravity.Martínez, E. (2020) Estadística.
- Regression line of Y on X The regression line of Y
on X is used to estimate the Y values from those
of the X. The slope of the line is the ratio
between the covariance and the variance of the
variable X.
- Regression line of X on Y The regression line of X on Y is
used to estimate the values of X from the of the Y The
slope of the line is the ratio between the covariance and
the variance of the variable Y. Regression line
- If the correlation is null, r = 0, the lines of
regression are perpendicular to each other, and
their equations are:
- Y = mean of Y
- X = mean of X
- Y = mean of Y
- Regression line of Y on X The regression line of Y
on X is used to estimate the Y values from those
of the X. The slope of the line is the ratio
between the covariance and the variance of the
variable X.
- The regression line is the one that best fits the point cloud. The
regression line passes through center of gravity point called
center of gravity.Martínez, E. (2020) Estadística.
Media attachments
Want to create your own Mind Maps for free with GoConqr? Learn more.