14314025
Description
Mind Map by Zach Ryder, updated more than 1 year ago
|
|
Created by Zach Ryder
over 7 years ago
|
|
Chapter 1- Setting the
Statistical Scene
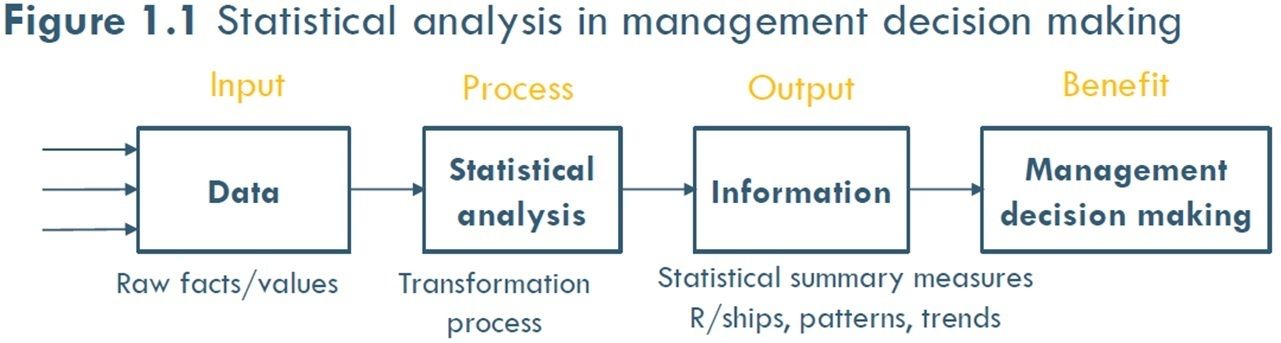
- Introduction
- Statistics as a set
of mathematically
based tools and
techniques to
transform raw
(unprocessed)
data in to a few
summary
measures that
represent useful
and usable
information to
support effective
decision making
- The statistical
analysis in
management
decision making
is performed via
a Management
decision support
system which is
illustrated in
- Statistics as a set
of mathematically
based tools and
techniques to
transform raw
(unprocessed)
data in to a few
summary
measures that
represent useful
and usable
information to
support effective
decision making
- The Language of
Statistics
- A number of important
terms, concepts and symbols
are used extensively in
statistics
- Random
variable:
- Any attribute
of interest on
which data is
collected and
analysed
- Any attribute
of interest on
which data is
collected and
analysed
- Data:
- The actual
values
(numbers)
or outcomes
recorded on
a random
variable
- The actual
values
(numbers)
or outcomes
recorded on
a random
variable
- Information:
- The results
of data
processing,
and is
meaningful
- The results
of data
processing,
and is
meaningful
- Sample:
- A fraction or a subset
of a population that
is selected in order to
carry out a survey. In
many cases,
researchers are
compelled to use
sample data instead
of the full population
- A fraction or a subset
of a population that
is selected in order to
carry out a survey. In
many cases,
researchers are
compelled to use
sample data instead
of the full population
- Sampling unit:
- The object being
measured, counted
or observed with
respect to the
random variable
under study
- The object being
measured, counted
or observed with
respect to the
random variable
under study
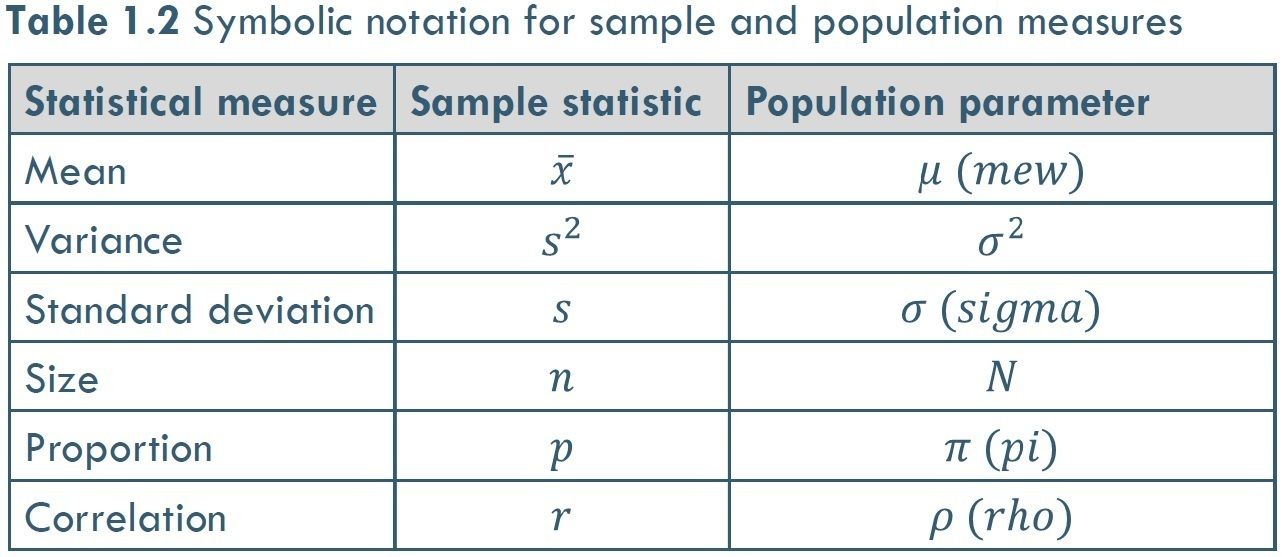
- Sample
statistic:
- A measure that
describes a
characteristic of
a sample
- A measure that
describes a
characteristic of
a sample
- Population:
- The collection of
all possible data
values that exist
for the random
variable under
study
- The collection of
all possible data
values that exist
for the random
variable under
study
- Population parameter:
- A measure that
describes a
characteristic
of a population
- A measure that
describes a
characteristic
of a population
- Random
variable:
- A number of important
terms, concepts and symbols
are used extensively in
statistics
- Components
of Statistics
- Descriptive statistics:
condenses sample data into
a few summary descriptive
measures
- When large
quantities of data
have been
gathered, there is
a need to organise,
summarise and
extract the
essential
information
contained within
this data for
communication to
management
- These
summary
measures
allow a user
to identify
profiles,
patterns,
relationships
and trends
within the
data
- When large
quantities of data
have been
gathered, there is
a need to organise,
summarise and
extract the
essential
information
contained within
this data for
communication to
management
- Inferential statistics:
generalises sample
findings to the broader
population
- Descriptive statistics only
describes the behaviour
of a random variable in a
sample
- However,
management is
mainly concerned
about the
behaviour and
characteristics of
random variables
in the population
from which the
sample was drawn
- Inferential statistics is that
area of statistics that allows
managers to understand the
population picture of a
random variable based on
the sample evidence
- Inferential statistics is that
area of statistics that allows
managers to understand the
population picture of a
random variable based on
the sample evidence
- However,
management is
mainly concerned
about the
behaviour and
characteristics of
random variables
in the population
from which the
sample was drawn
- Descriptive statistics only
describes the behaviour
of a random variable in a
sample
- Statistical modelling: builds
models of relationships between
random variables
- Constructs equations between
variables that are related to
each other
- These equations
(called models)
are then used to
estimate or
predict values of
one of these
variables based on
values of related
variables
- These equations
(called models)
are then used to
estimate or
predict values of
one of these
variables based on
values of related
variables
- Constructs equations between
variables that are related to
each other
- Descriptive statistics:
condenses sample data into
a few summary descriptive
measures
- Statistical
Applications in
Management
- Finance
- At a company level,
statistics is used to
assess the validity of
different investment
projects
- At a company level,
statistics is used to
assess the validity of
different investment
projects
- Marketing
- analyse consumer
behaviour,
purchasing patterns,
identifying viable
market segments,
determining media
effectiveness
- analyse consumer
behaviour,
purchasing patterns,
identifying viable
market segments,
determining media
effectiveness
- Human
Resources
- training,
employee
turnover,
compensation
planning,
employee issues
- training,
employee
turnover,
compensation
planning,
employee issues
- Operations/
Logistics
- machine
utilisation,
labour
utilisation
- machine
utilisation,
labour
utilisation
- Finance
- Data and
Data
Quality
- Data Quality
- "Garbage
in,
garbage
out"
- Is influenced
by four factors:
datatype, data
source, the
method of data
collection, data
preparation
- "Garbage
in,
garbage
out"
- Selection of
Statistical
Method
- Depends on
management
problem to be
addressed
and then on
the type of
data available
- Depends on
management
problem to be
addressed
and then on
the type of
data available
- Data Quality
- Data Types &
Measurement
Scales
- Measurement
Scales:
- The scale
determines the
extent to which the
data can be
manipulated and
also which
statistical methods
are appropriate to
use on the data to
produce valid
statistical results
- Nominal data
- is associated with
categorical data. If all
the categories of a
qualitative random
variable are of equal
importance, then this
categorical data is
termed
‘nominal-scaled’
- gender (1 =
male; 2 =
female)
- city of residence
(1 = PTA; 2 =
DBN)
- is associated with
categorical data. If all
the categories of a
qualitative random
variable are of equal
importance, then this
categorical data is
termed
‘nominal-scaled’
- Ordinal data
- is also associated
with categorical
data, but has an
implied ranking
between the
different
categories of the
qualitative
random variable
- Each consecutive
category possesses
either more or less
than the previous
category of a given
characteristic
- size of
clothing (1
= small; 2
= medium)
- product
usage level
(1 = light; 2
= moderate;
3 = heavy)
- is also associated
with categorical
data, but has an
implied ranking
between the
different
categories of the
qualitative
random variable
- Interval
data
- Interval data is
associated with
numeric data and
quantitative
random variables
- It is generated mainly
from rating scales,
which are used in
survey
questionnaires to
measure respondents’
attitudes
- Interval data is
associated with
numeric data and
quantitative
random variables
- Ratio data
- Ratio data
consists of all
real numbers
associated
with
quantitative
random
variables
- employee
ages (years),
customer
income (R),
distance
travelled
(km)
- Ratio data has all
the properties of
numbers (order,
distance and an
absolute origin of
zero) that allow
such data to be
manipulated using
all arithmetic
operations
- Ratio data
consists of all
real numbers
associated
with
quantitative
random
variables
- Nominal data
- The scale
determines the
extent to which the
data can be
manipulated and
also which
statistical methods
are appropriate to
use on the data to
produce valid
statistical results
- Data Types
- Qualitative
random
variables
- Generate
categorical
(non-numeric)
response data.
The data is
represented by
categories only
- gender of a
consumer
- an employee’s
highest
qualification
- gender of a
consumer
- Generate
categorical
(non-numeric)
response data.
The data is
represented by
categories only
- Quantitative
random
variables
- Generate numeric
response data.
These are real
numbers that can
be manipulated
using arithmetic
operations (add,
subtract, multiply
and divide)
- age of an
employee
- machine
downtime
- price of a product in
different stores
- age of an
employee
- Generate numeric
response data.
These are real
numbers that can
be manipulated
using arithmetic
operations (add,
subtract, multiply
and divide)
- Discrete data:
is whole
number (or
integer) data
- no. of
students in
a class, no
of cars sold
- no. of
students in
a class, no
of cars sold
- Continuous
data: is any
number that
can occur in
an interval
- the time needed
for an assembly
line, the volume
of fuel for a car
- the time needed
for an assembly
line, the volume
of fuel for a car
- Qualitative
random
variables
- Measurement
Scales:
- Data Sources
- Classification
- internal
- financial
reports;
departmental
records or
reports
- financial
reports;
departmental
records or
reports
- external
- internet;
media
- internet;
media
- internal
- Primary data is
data that is
recorded for the
first time at
source and with
a specific
purpose in mind
- advantage of
primary-sourced
data is its high
quality
- disadvantage of
primary-sourced
data is that it can be
time consuming and
expensive to collect
- advantage of
primary-sourced
data is its high
quality
- Secondary data
is data that
already exists
in a processed
format
- advantages. First, its
access time is
relatively short
(especially if the data
is accessible through
the internet), and
second it is generally
less expensive
- disadvantages are
that the data may
not be problem
specific (i.e. problem
of its relevancy), it
may be out of date
- advantages. First, its
access time is
relatively short
(especially if the data
is accessible through
the internet), and
second it is generally
less expensive
- Classification
- Data
Collection
Methods
- Observation
- Primary data can be collected by observing
a respondent or a process in action
- Advantage: the respondent is unaware of being observed
and therefore behaves more naturally or spontaneously
- Disadvantage: the passive form of data collection.
There is no opportunity to probe for reasons or
to further investigate underlying causes
- Primary data can be collected by observing
a respondent or a process in action
- Surveys
- The direct questioning of respondents using
questionnaires to structure and record the data collection
- Advantages: a higher response rate is generally achieved. it allows
probing for reasons. the data is current and generally more accurate
- Disadvantages: personal interviews are:
time consuming. expensive to conduct
- The direct questioning of respondents using
questionnaires to structure and record the data collection
- Telephone
interviews
- Advantages: cost is relatively low. questions
can be clarified by the interviewer
- Disadvantage: loss of respondent anonymity
- Advantages: cost is relatively low. questions
can be clarified by the interviewer
- Experimentation
- the analyst
manipulates
certain variables
under controlled
conditions
- Advantage:
high
quality
- Disadvantage
costly and
time-consuming
- the analyst
manipulates
certain variables
under controlled
conditions
- E-survey
- Is geographically dispersed
and it is not practical to
conduct personal interviews
- Advantages: Interviewer bias is eliminated.
anonymity of each respondent is assured
- Disadvantage: low
response rates
- Is geographically dispersed
and it is not practical to
conduct personal interviews
- Observation
Media attachments
Want to create your own Mind Maps for free with GoConqr? Learn more.