1434072
Break Even Analysis
- Costs
- Fixed
- Costs that don't change
depending on output e.g. rent, bills
- Costs that don't change
depending on output e.g. rent, bills
- Variable
- Costs that do change depending on
output e.g. petrol, raw materials
- Variable costs x output
- Variable costs x output
- Costs that do change depending on
output e.g. petrol, raw materials
- Fixed
- Break Even Formula
- Fixed Cost divided by Contribution
- Contribution = Selling
price - Variable cost
- Contribution = Selling
price - Variable cost
- Fixed Cost divided by Contribution
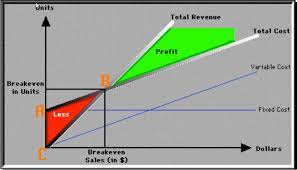
- Graphs
- Profit is anything above the
point where the total socts
crosses the revenue
- Profit is anything above the
point where the total socts
crosses the revenue
- Profits, Cost and
Revenue
- Profit
- Revenue - Total Costs
- Revenue - Total Costs
- Costs
- The expenses the business has to pay
- The expenses the business has to pay
- Revenue
- The total amount of money made from sales
- Output x Selling Price
- The total amount of money made from sales
- Profit
- Break even analysis is
calculating the break even
point, using fixed costs,
variable costs and revenue
- Uses
- Can see how much stock needs to
be sold before hand
- Helps companies set targets
- Can see how much stock needs to
be sold before hand
- Limitations
- It assumes everything gets
sold and nothing is kept for
stock
- Hard to do for multiple products as
it would be a tedious process
- It assumes everything gets
sold and nothing is kept for
stock
- Uses
Media attachments
Want to create your own Mind Maps for free with GoConqr? Learn more.