20003164
Description
Mind Map by lizabeth rawson, updated more than 1 year ago
|
|
Created by lizabeth rawson
over 6 years ago
|
|
Histograms and frequency density
- histogram = bar chart where the bars can be different widths
- y axis = frequency density
- frequency density = frequency / class width
- frequency = frequency density x class width = area of bar
- frequency = frequency density x class width = area of bar
- frequency density = frequency / class width
- Example
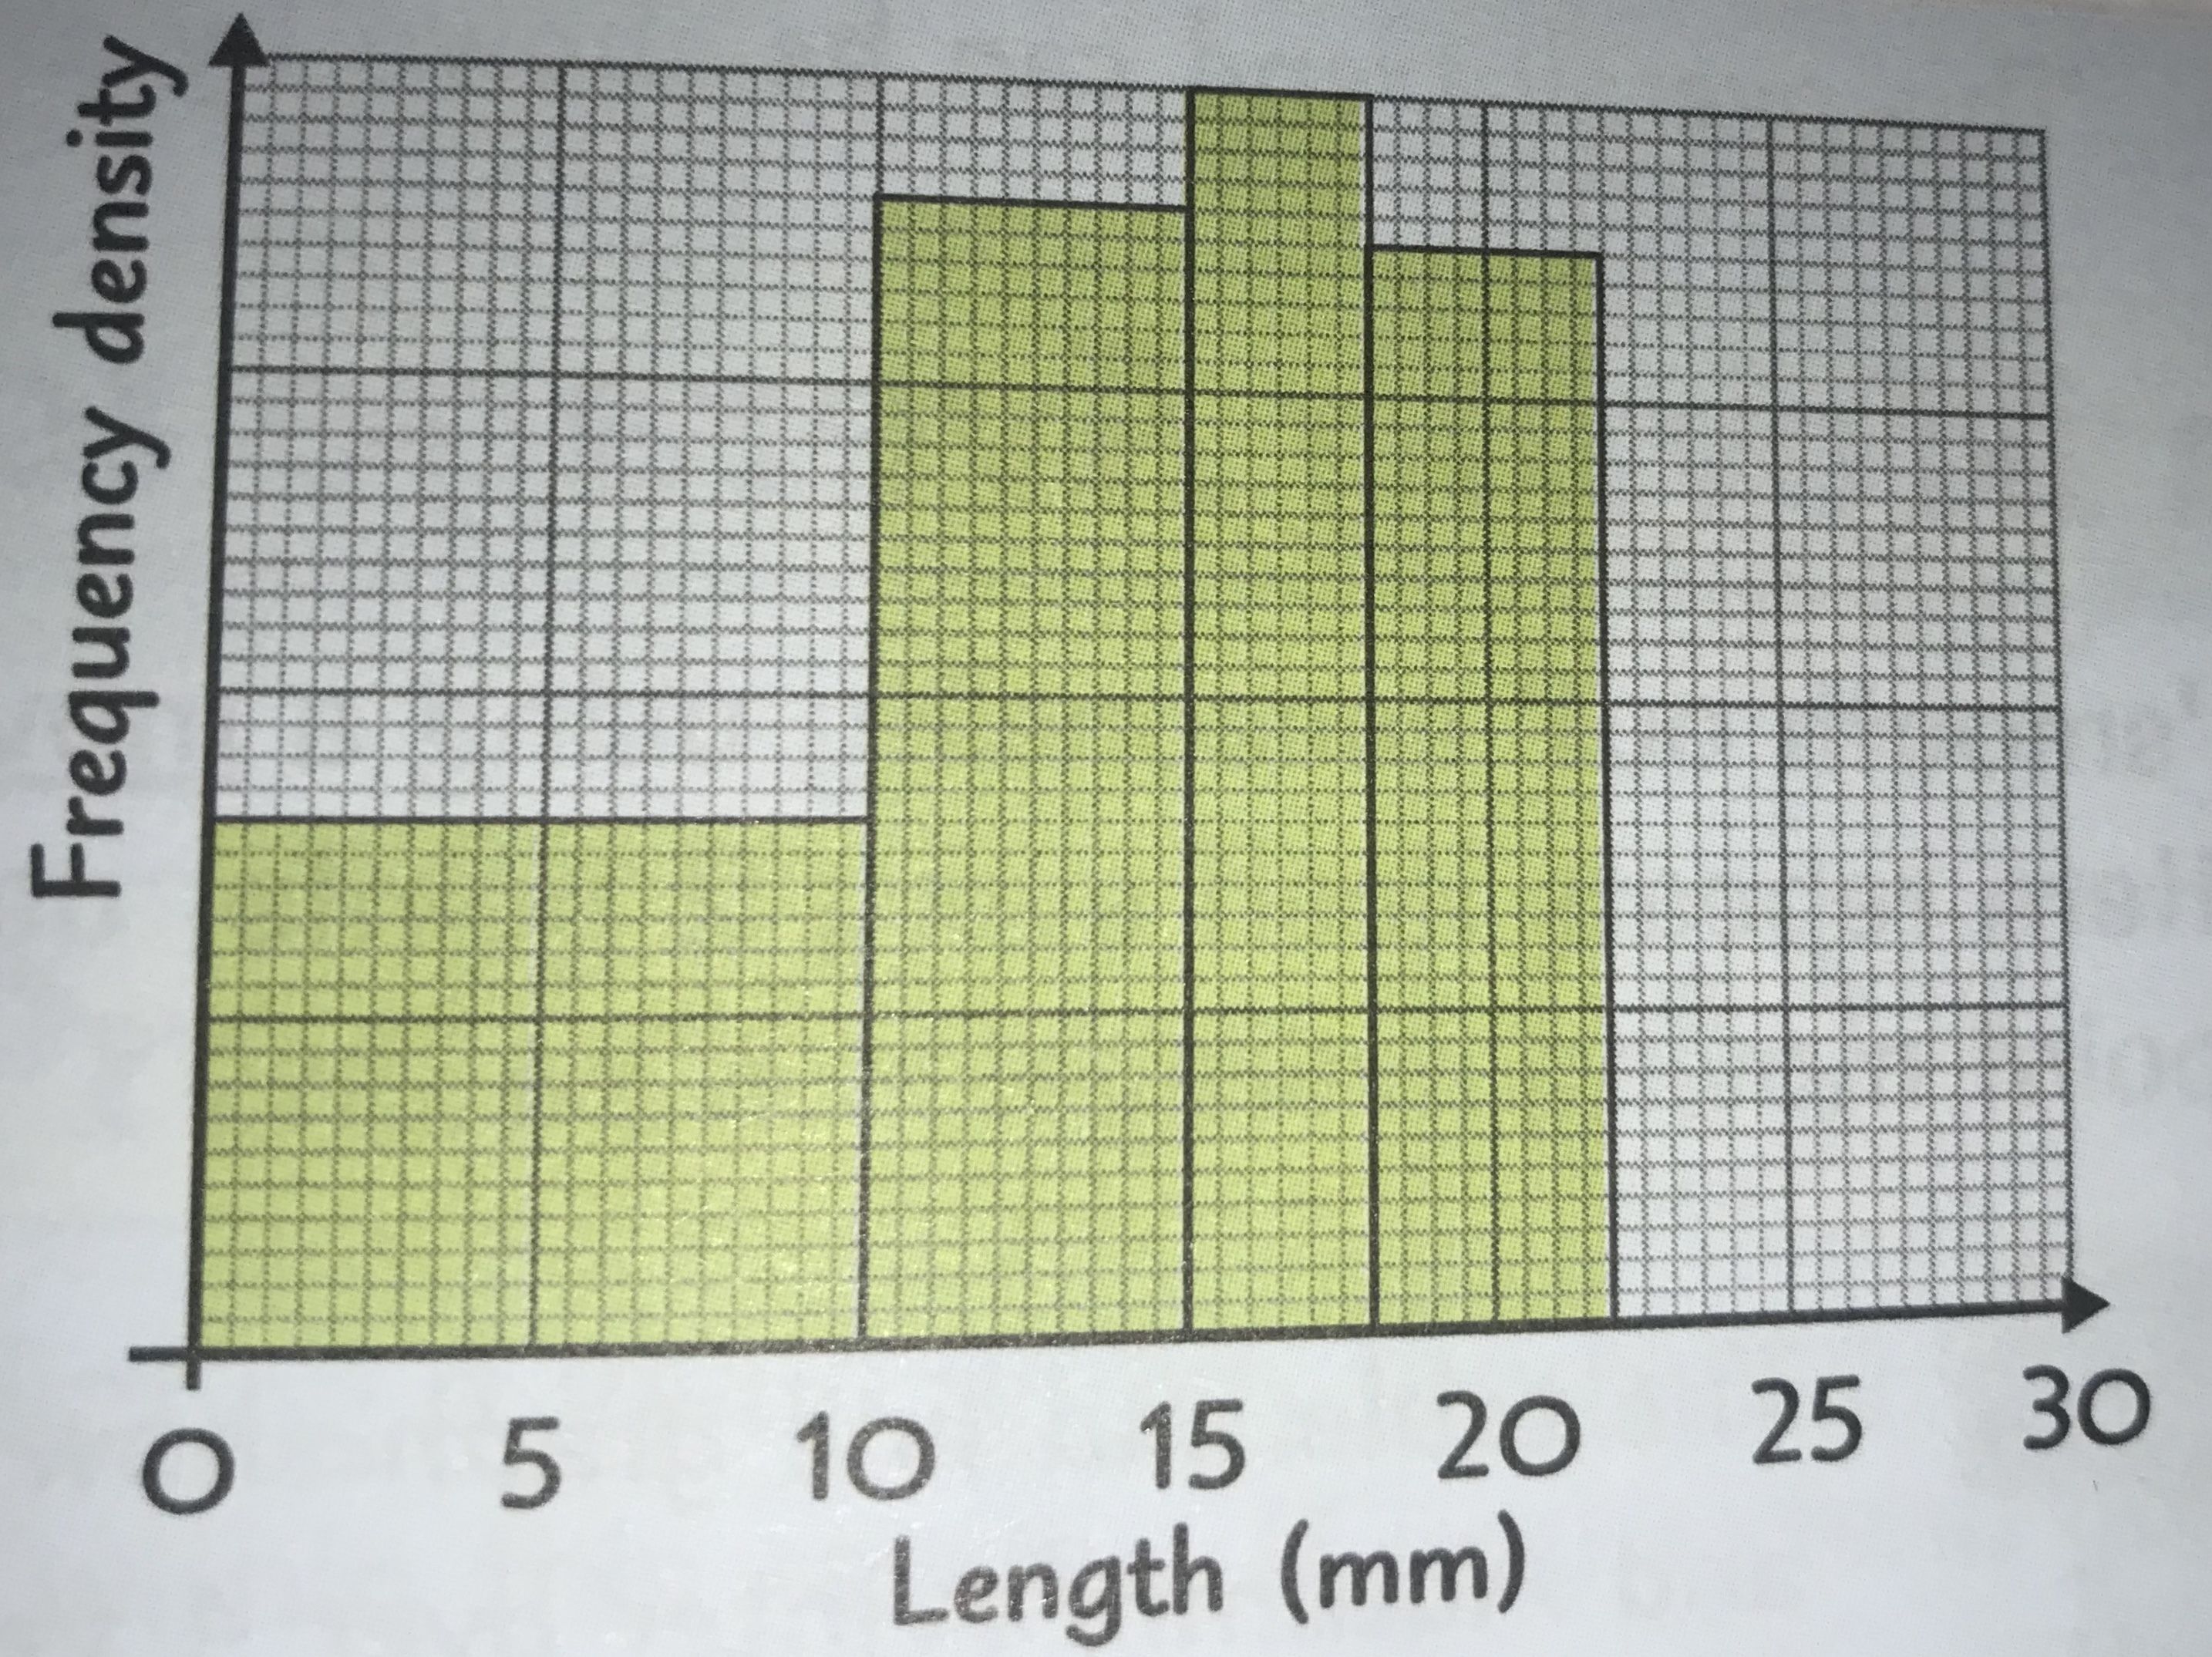
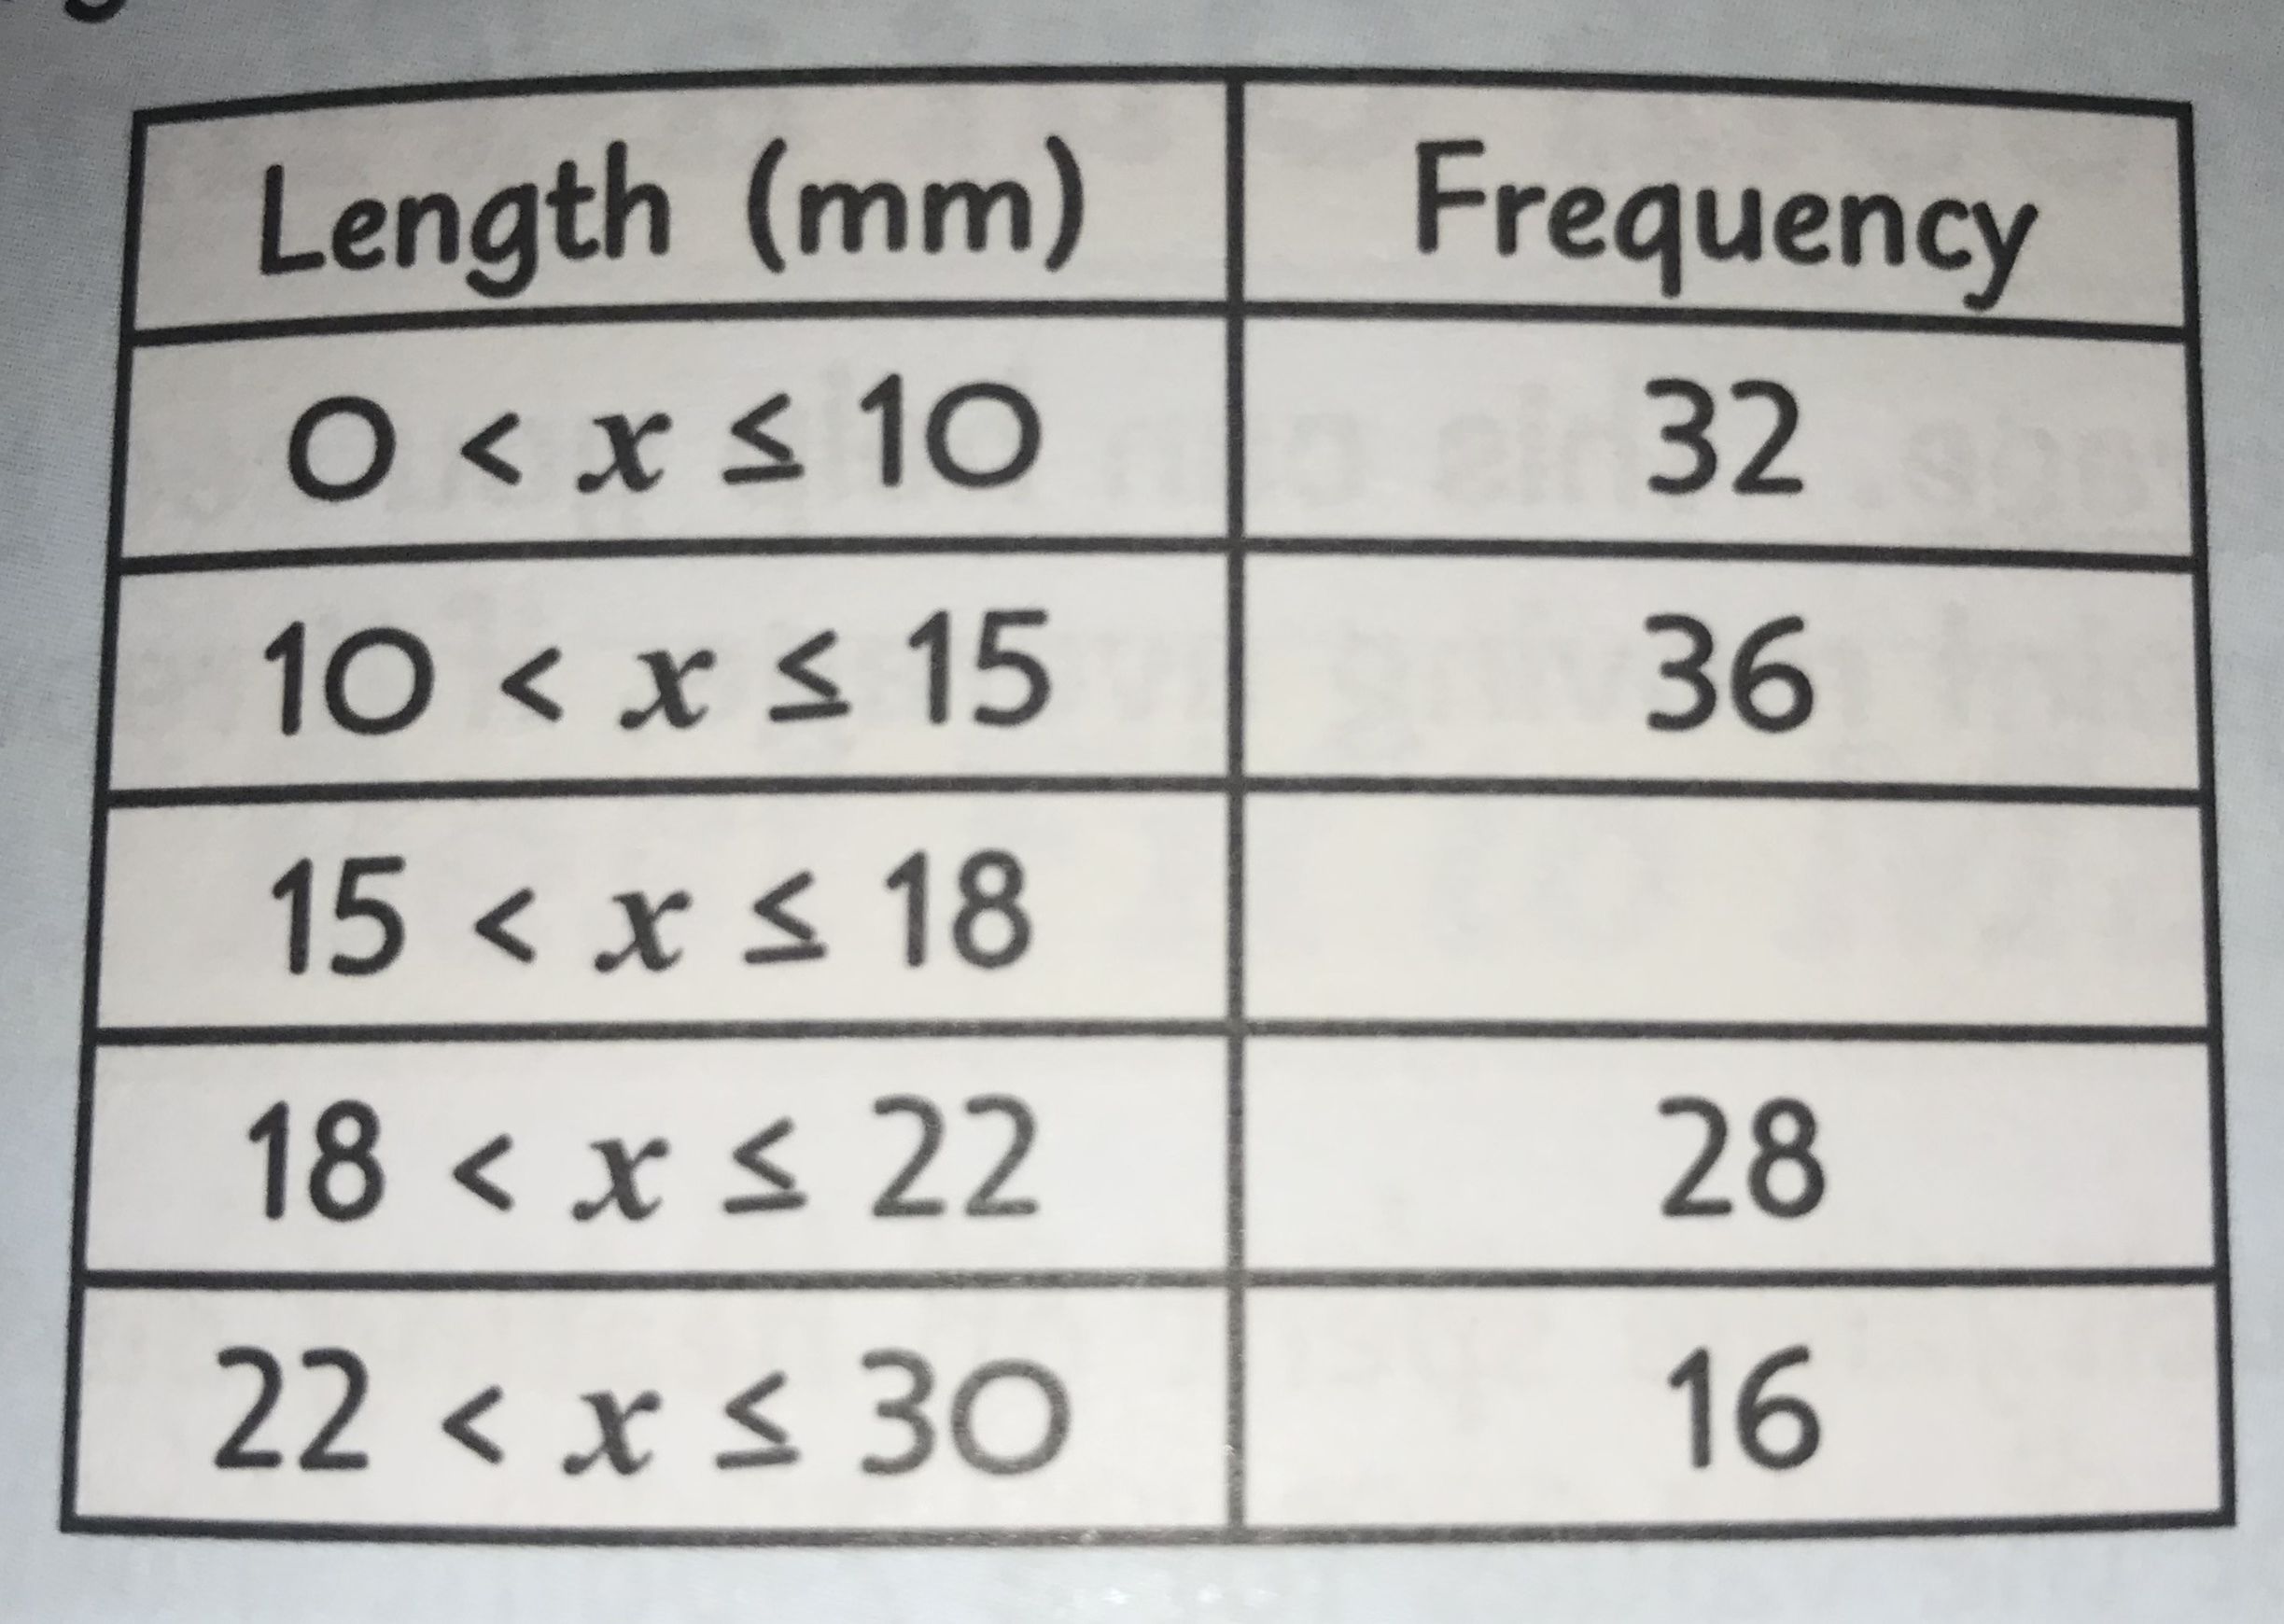
- this table and histogram show the lengths of beetles in a garden
- use the histogram to find the missing entry in the table
- the frequency = the frequency density x the class width
- so 18 - 15 = 3 = class width
- frequency density = 8
- 8 x 3 = 24
- the missing value is 24
- the missing value is 24
- 8 x 3 = 24
- frequency density = 8
- so 18 - 15 = 3 = class width
- the frequency = the frequency density x the class width
- use the histogram to find the missing entry in the table
- this table and histogram show the lengths of beetles in a garden
Media attachments
Want to create your own Mind Maps for free with GoConqr? Learn more.