2669985
Description

Mind Map by Jason Edwards-Suarez, updated more than 1 year ago
|
|
Created by Jason Edwards-Suarez
almost 9 years ago
|
|
Geography Unit
1, World at risk
- Weather Patterns
- El Niño
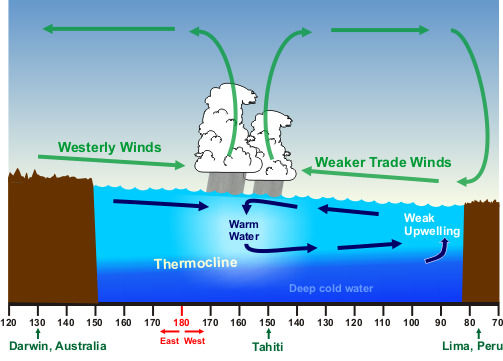
- El Niño is a climate pattern that describes the unusual warming
of surface waters along the tropical west coast of South America.
El Nino has an impact on ocean temperatures, the speed and
strength of ocean currents, the health of coastal fisheries, and
local weather from Australia to South America.
- Occurs every 2-7
years
- Effects on places
- South America
- Because El Niño's warm pool feeds
thunderstorms above, it creates increased
rainfall across the east-central and eastern
Pacific Ocean, including several portions of
the South American west coast. The effects
of El Niño in South America are direct and
stronger than in North America. An El Niño
is associated with warm and very wet
weather months in April–October along
the coasts of northern Peru and Ecuador,
causing major flooding whenever the
event is strong or extreme.
- El Niño reduces the upwelling of cold,
nutrient-rich water that sustains large
fish populations, which in turn sustain
abundant sea birds, whose droppings
support the fertilizer industry. The
reduction in upwelling leads to fish kills
off the shore of Peru.
- During the 1982–83 event, jack mackerel and
anchovy populations were reduced, scallops
increased in warmer water, but hake followed
cooler water down the continental slope,
while shrimp and sardines moved southward,
so some catches decreased while others
increased. Horse mackerel have increased in
the region during warm events. Shifting
locations and types of fish due to changing
conditions provide challenges for fishing
industries. Peruvian sardines have moved
during El Niño events to Chilean areas.
- Because El Niño's warm pool feeds
thunderstorms above, it creates increased
rainfall across the east-central and eastern
Pacific Ocean, including several portions of
the South American west coast. The effects
of El Niño in South America are direct and
stronger than in North America. An El Niño
is associated with warm and very wet
weather months in April–October along
the coasts of northern Peru and Ecuador,
causing major flooding whenever the
event is strong or extreme.
- Indonesia and Australia
- As warm water spreads from the west Pacific and the Indian Ocean to the east
Pacific, it takes the rain with it, causing extensive drought in the western Pacific
and rainfall in the normally dry eastern Pacific. Singapore experienced the
driest February in 2014 since records began in 1869, with only 6.3 mm of rain
falling in the month and temperatures hitting as high as 35 °C on 26 February.
The years 1968 and 2005 had the next driest Februaries, when 8.4 mm of rain
fell.
- Droughts to Indonesia and Australia. These droughts threaten water
supplies, as local reservoirs dry up and rivers carry less water. Agriculture,
which depends on water for irrigation, is threatened.
- See Phillippines case study
- As warm water spreads from the west Pacific and the Indian Ocean to the east
Pacific, it takes the rain with it, causing extensive drought in the western Pacific
and rainfall in the normally dry eastern Pacific. Singapore experienced the
driest February in 2014 since records began in 1869, with only 6.3 mm of rain
falling in the month and temperatures hitting as high as 35 °C on 26 February.
The years 1968 and 2005 had the next driest Februaries, when 8.4 mm of rain
fell.
- North America
- See California Case
Study
- See California Case
Study
- South America
- The El Niño event of 1997-98 is regarded as the
strongest of the 20th century. This was the first El
Niño event to be scientifically monitored from
beginning to end. The 1997-98 event produced
severe drought conditions in Indonesia, Malaysia,
and the Philippines. Peru experienced very heavy
rains and severe flooding. In the United States,
increased winter rainfall hit California, while the
Midwest experienced record-breaking warm
temperatures during a period known as "the year
without a winter."
- By the time it had run its course eight months later,
the giant El Niño of 1997-98 had deranged weather
patterns around the world, killed an estimated 2,100
people, and caused at least 33 billion [U.S.] dollars in
property damage.
- The mosquitoes that thrived in these places caused
rampant malaria—some 30,000 cases in the Piura
region alone, three times the average for its 1.5
million residents.
- The Piura region is in North West Peru
- The Piura region is in North West Peru
- Temperatures reached 108°F [42°C] in Mongolia;
Kenya’s rainfall was 40 inches [100 centimeters]
above normal; central Europe suffered record
flooding that killed 55 in Poland and 60 in the
Czech Republic; and Madagascar was battered
with monsoons and cyclones. In the U.S.
mudslides and flash floods flattened communities
from California to Mississippi, storms pounded the
Gulf Coast, and tornadoes ripped Florida.
- By the time it had run its course eight months later,
the giant El Niño of 1997-98 had deranged weather
patterns around the world, killed an estimated 2,100
people, and caused at least 33 billion [U.S.] dollars in
property damage.
- In addition to increased natural hazards and economic
devastation, health crises are also associated with El Niño
events. Diseases carried by mosquitoes and flies, such as
dengue fever and malaria, increase as warmer, more humid
weather expands mosquitoes habitat.
- El Niño is a climate pattern that describes the unusual warming
of surface waters along the tropical west coast of South America.
El Nino has an impact on ocean temperatures, the speed and
strength of ocean currents, the health of coastal fisheries, and
local weather from Australia to South America.
- La Niña
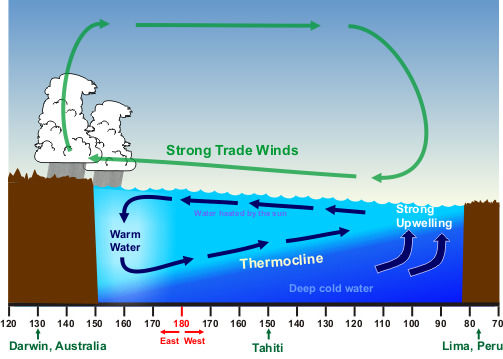
- There are occasions when the trade winds that blow west across the
tropical Pacific are stronger than normal leading to increased upswelling
off South America and hence the lower than normal sea surface
temperatures. The prevailing rain pattern also shifts farther west than
normal. These winds pile up warm surface water in the West Pacific. This is
the cool phase of ENSO called La Niña.
- Effects
- Generally, the Opposite
of an El Niño year
- La Niña is characterized by lower-than-normal air pressure over the
western Pacific. These low-pressure zones contribute to increased rainfall.
- However, strong La Niña events are associated with catastrophic floods in northern Australia. The 2010 La
Niña event correlates with one of the worst floods in the history of Queensland, Australia. More than 10,000
people were forced to evacuate, and damage from the disaster was estimated at more than $2 billion.
- Rainfall associated with the summer monsoon in Southeast Asia tends to be greater than normal,
especially in northwest India and Bangladesh. This generally benefits the Indian economy, which
depends on the monsoon for agriculture and industry.
- La Niña usually has a positive impact on the fishing industry of western South America.
Upwelling brings cold, nutrient-rich waters to the surface. Nutrients include plankton
eaten by fish and crustaceans. Higher-level predators, including high-value fish species
such as sea bass, prey on the crustaceans.
- La Niña events may last between one
and three years, unlike El Niño, which
usually lasts no more than a year. Both
phenomena tend to peak during the
Northern Hemisphere winter.
- Generally, the Opposite
of an El Niño year
- Scientists use the Oceanic Nino Index to
measure the deviations from normal
sea-surface temperatures that El Niño and La
Niña produce in the east-central Pacific
Ocean. La Niña events are indicated by
sea-surface temperature decreases of more
than .5 degrees Celsius (.9 degrees
Fahrenheit) for at least five successive
three-month seasons.
- There are occasions when the trade winds that blow west across the
tropical Pacific are stronger than normal leading to increased upswelling
off South America and hence the lower than normal sea surface
temperatures. The prevailing rain pattern also shifts farther west than
normal. These winds pile up warm surface water in the West Pacific. This is
the cool phase of ENSO called La Niña.
- Extreme weather
- Distribution
- Including hurricanes (North America), cyclones (India) and typhoons (Japan and East Asia). They all occur in a
band that lies roughly between the tropics of Cancer and Capricorn and despite varying wind speeds are
ferocious storms. Some storms can form just outside of the tropics, but in general the distribution (location)
of these storms is controlled by the places where sea temperatures rise above 27°C. The highest number of
storms does not occur in the Atlantic close to the USA, but in the North Pacific affecting countries such as the
Philippines and Japan. This is despite the fact that in the UK we only really get to hear about tropical storms
affecting the USA. The most affected area being South East Asia receives an average of 26 storms per year.
The least affected area is India where there is an average of 2 tropical storms per year.
- Equatorial belt, 5-20 degrees north
and south of the equator
- Including hurricanes (North America), cyclones (India) and typhoons (Japan and East Asia). They all occur in a
band that lies roughly between the tropics of Cancer and Capricorn and despite varying wind speeds are
ferocious storms. Some storms can form just outside of the tropics, but in general the distribution (location)
of these storms is controlled by the places where sea temperatures rise above 27°C. The highest number of
storms does not occur in the Atlantic close to the USA, but in the North Pacific affecting countries such as the
Philippines and Japan. This is despite the fact that in the UK we only really get to hear about tropical storms
affecting the USA. The most affected area being South East Asia receives an average of 26 storms per year.
The least affected area is India where there is an average of 2 tropical storms per year.
- Conditions
- Ocean temp over 27 degrees
- At least 50m water depth
- Ocean temp over 27 degrees
- Hurricane Jeanne
- Winds estimated to be
193 km/h
- Category 3 on
Saffir-Simpson scale
- The most severe impact from Hurricane Jeanne was the immense rainfall it produced. The Caribbean islands saw
extreme amounts of precipitation and the consequences were deadly. At Vieques, Puerto Rico, 610 mm (24 in) of rain fell.
Historic flooding occurred throughout the island causing $169.5 million (2004 USD) in damage but only claiming 8 lives. In
Haiti, 330 mm (13 in) fell over the northern mountains producing catastrophic mudslides. Over 3,000 people died as a
result, with almost 2,900 of them perishing in the coastal city of Gonaïves. Over two dozen people were killed in the
neighboring Dominican Republic after rainfall led to flooding there as well. 12th deadliest Atlantic hurricane on records.
- Winds estimated to be
193 km/h
- Distribution
- El Niño
- The Arctic
- Climate Change
- Rising sea
levels
- Melting Ice Caps has resulted in loss of
habitats and disruption of ecosystems
- The Greenland Ice Sheet
- Huge levels of sea level rise
- Caused by the emission of greenhouse
gasses and environmental pollution
increasing sea and air temperatures
- From 1979 to 2006, summer ice melt
has increased by 30%
- This has opened trade routes for shipping thus adding
to oil and shale gas exploration. This is only worsening
the situation as the oil rigs create even more
greenhouse gasses and add to the effects of global
warming
- Huge levels of sea level rise
- Thermal expansion
- Rising sea
levels
- Spruce Bark Beatles are
eating Alaskan forests. From
1993 to 2003 over 3.4 million
acres of forest was eaten.
- Sea Ice Melt
- Resulting in loss of habitat for polar animals e.g. polar
bears and seals which use the ice to hunt. This could lead
to a reduction in biodiversity which is detrimental to the
whole ecosystem.
- More ice melting results in less albedo affect as the suns light reaches
more of the ocean which absorbs it rather than the ice reflecting it
back. This leads to exponential increase in the sea ice melt as the more
ice that melts the more suns radiation is absorbed and further sea level
temperature increase takes places.
- Low lying countries such as Bangladesh are at extremely
high risk of flooding from sea level rise and as a poor
country the effects of flooding will be catastrophic.
- The Netherlands is a very low lying country which is at a very high
risk of flooding due to sea level rise however as a wealthy MEDC
the capacity to cope with these hazards is far greater than poor
nations such as Bangladesh.
- London is also a low lying city however as the capital city of a
wealthy country it has money in order to spend adapting to sea
level rise. A good example of this is the Thames Flood Barrier.
- At current rates
50% of Arctic ice will
be lost by 2100
- The arctic ecosystem is highly vulnerable as it is deeply adapted
to an intense, seasonal climate. It relies upon a continuous, very
cold winter.
- There is evidence that this winter is fast disappearing to be
replaced by more variable cold-thaw conditions whichlead
to iceing, fails to kill pests, and promotes waterlogging.
- There is evidence that this winter is fast disappearing to be
replaced by more variable cold-thaw conditions whichlead
to iceing, fails to kill pests, and promotes waterlogging.
- Resulting in loss of habitat for polar animals e.g. polar
bears and seals which use the ice to hunt. This could lead
to a reduction in biodiversity which is detrimental to the
whole ecosystem.
- 6-8 degrees warming
by 2100 considered a
distinct possibility
- Climate Change
- The Phillippines
- 7,107 Islands
- Only about 2000 inhabited
- Very difficult to
access everyone in
case of a disaster
- Only about 2000 inhabited
- Situated on the western fringes of the Pacific
Ring of Fire, the Philippines experiences frequent
seismic and volcanic activity. The Benham Plateau
to the east in the Philippine Sea is an undersea
region active in tectonic subduction. Around 20
earthquakes are registered daily, though most
are too weak to be felt. The last major earthquake
was the 1990 Luzon earthquake.
- Earthquakes
- Sits on destructive plate
boundary
- The Luzon earthquake
- July 16 1990
- 7.8 magnitude
- 500 dead
- Lots of the surrounding area
was rural so less vulnerable
- Less debris, electrics, gas (reduced risk of aftershock damages)
- Less debris, electrics, gas (reduced risk of aftershock damages)
- July 16 1990
- Sits on destructive plate
boundary
- Volcanoes
- The Pacific
ring of fire
- Oceanic Phillippines plate is
subducting under the Eurasian
plate at 16cm per year
- 37 volcanoes,
18 active
- Mount Pinatubo
- 15th June 1991
- 700+ killed
- $500,000,000
property
damage
- Cyclone Yunya followed causing
major rainfall and lahars which
resulted in more deaths
- 15th June 1991
- The Pacific
ring of fire
- Drought
- Climate is 25-28 degrees,
during El Nino hot and dry
- Wildfires
- Wildfires
- 1997-98 El Nino
- 2,600,000 people affected
- Farmers only got 30%
of normal income
- 72 dead due to
stagnant water
- 90% of the country got
below 50% average rainfall
- 2,600,000 people affected
- Climate is 25-28 degrees,
during El Nino hot and dry
- 7,107 Islands
- California
- Earthquakes
- Conservative and destructive
boundaries on the northern
end of California
- San Andreas Fault
line, conservative
plate boundary
- Loma Prieta
- 17 October
1989
- 7.1 on richter scale
- 63 deaths
- $6 billion damages
- 1,018 homes destroyed
- 17 October
1989
- Conservative and destructive
boundaries on the northern
end of California
- Drought
- Caused by high
pressure, anti-cyclonic
conditions
- Santa Ana winds bring dry wins
down from death valley. Stops low
pressure and the weather which
comes from low pressure
- Drought 2013-2014
- July 1st 2013-
January 13th 2014
- Received just 20% of
normal rainfall (2.1 inches)
- 1/3 of all food made in USA is in California so this
drought had major implication for food production. The
human vulnerability is increased here therefore as the
whole of the US is affected by droughts here.
- Resulted in 5059 fires
across 90,375 acres of land
- July 1st 2013-
January 13th 2014
- Caused by high
pressure, anti-cyclonic
conditions
- Wildfires
- 2012-2013
- Burnt over 600,000
acres of land
- 2012 $481.7 million spent fighting
fires 2013 $599 million spent
- Winds fueled the fire further into towns
and cities with the dense populations
making impacts more extreme in these
areas
- Burnt over 600,000
acres of land
- 2012-2013
- Earthquakes
- Africa
- Lowest contribution to global warming
- Predicted temp change 4-5
degrees above global rate
- More rain in equatorial band
but less above and below
- Water
- Regulated by
HEP, domestic
and industry
- Rivers shared e.g. Nile
- Conflict
- Conflict
- Regulated by
HEP, domestic
and industry
- Food insecurity
- 70% of population subsistence farmers
who may starve with water shortages
- Increased locust plagues
- 70% of population subsistence farmers
who may starve with water shortages
- Natural resources
- Loss of safari tourism industry
in places like Kenya as the Big 5
wild animals will die out.
- In Africa, the big five game animals
are the African lion, African elephant,
Cape buffalo, African leopard, and
White/Black rhinoceros.
- In Africa, the big five game animals
are the African lion, African elephant,
Cape buffalo, African leopard, and
White/Black rhinoceros.
- 80% of remedies rely on wild
plants that are under threat.
- Loss of safari tourism industry
in places like Kenya as the Big 5
wild animals will die out.
- Vector borne and water borne
diseases could increase with climate
change - higher medical expenses
- Desertification
- Major destroyer of grassland
- Increased by unreliable
or decreasing rainfall
- Major destroyer of grassland
- Lowest contribution to global warming
Media attachments
Want to create your own Mind Maps for free with GoConqr? Learn more.