38556854
Description
Mind Map by bridny toro, updated more than 1 year ago
|
|
Created by bridny toro
about 3 years ago
|
|
the statistics
- The word "statistics" refers to a system or method
used in the collection, organization, analysis, and
numerical description of information. It can also
be said that statistics studies the behavior of
events or phenomena of groups. (Martínez, C.
(2012). Statistics and sampling).
- importance
- facilitates the visualization of
the data. They allow to be
presented in a meaningful and
understandable way, which in
turn allows for a simplified
interpretation of the data set in
question.
- facilitates the visualization of
the data. They allow to be
presented in a meaningful and
understandable way, which in
turn allows for a simplified
interpretation of the data set in
question.
- Troubleshooting
tools:
- Tables, graphs, measures
of central tendency,
dispersion, etc.
- Statistics is divided into
two branches:
- descriptive: organizing, collecting, and
communicating numerical information.
- Who in turn has different
types of analysis:
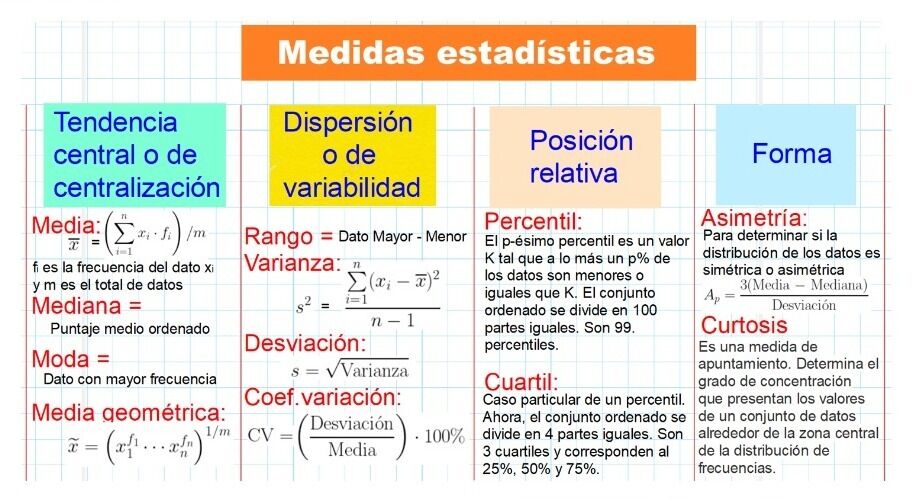
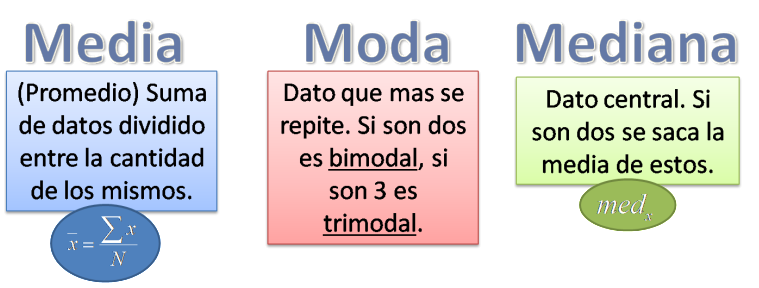
- central tendency: who
summarizes in a single
value, a data set.
- M. of dispersion: who indicates how far
the data is from the arithmetic mean
and tells us how variable our data are.
- M. de distribución: quien permite
ubicar gráficamente como se juntan los
valores de una muestra determinada
- central tendency: who
summarizes in a single
value, a data set.
- Who in turn has different
types of analysis:
- Inferential: conducts the conclusions of the population,
on the other hand it deals with the analysis,
interpretation of the results and the conclusions that
can be reached from the information obtained from a
sample in order to extend its results to the population
under study
- whose statistical sets can be
generalized as:
- attribute causes
- differences
- predict
- correlate
- analyze factors
- get effects and etc.
- attribute causes
- "inferential statistics use
the descriptive data to
perform specific analyses"
- whose statistical sets can be
generalized as:
- descriptive: organizing, collecting, and
communicating numerical information.
- Tables, graphs, measures
of central tendency,
dispersion, etc.
- In making
decisions:
- Statistics is a science that is responsible for
collecting, organizing, processing, analyzing and
interpreting data in order to deduce the
characteristics of a target group or population, its
importance lies in the fact that it is a highly reliable
source of information for decision making.
- On the other hand, in the correct decision making,
descriptive statistics is very fundamental since it
allows to know the main properties of the observed
data and the key characteristics of the studied
phenomena. It is through numerical descriptive
measures (mean, median, mode, mean deviation,
variance, standard deviation, coefficient of
variation, Fisher's coefficient, and coefficient of
variation) that the researcher can obtain
summarized information from the data, which
under conditions of uncertainty you want to
analyze to make a sound decision.
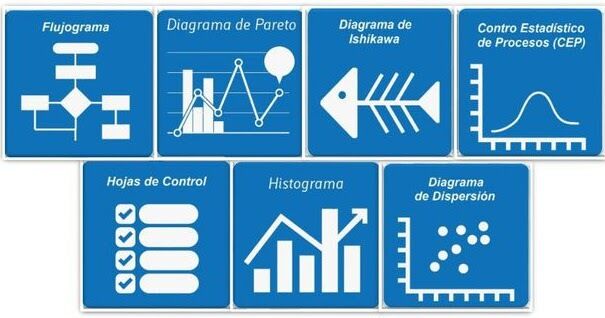
- Whose tools are: brainstorming, affinity diagram, Pareto
diagram, Ishikawa diagram (or cause and effect diagram).
- Statistics is a science that is responsible for
collecting, organizing, processing, analyzing and
interpreting data in order to deduce the
characteristics of a target group or population, its
importance lies in the fact that it is a highly reliable
source of information for decision making.
- Purpose of the
statistics:
- It is considered that its purpose is to provide
information and its usefulness will depend largely on
the purpose that is proposed and on the way in
which the data is obtained.
- It is considered that its purpose is to provide
information and its usefulness will depend largely on
the purpose that is proposed and on the way in
which the data is obtained.
Media attachments
Want to create your own Mind Maps for free with GoConqr? Learn more.