844658
Description
Mind Map by Alessandra Genco, updated more than 1 year ago
|
|
Created by Alessandra Genco
almost 10 years ago
|
|
Statistics - S1
- Mathematical models in probability
and statistics
- A mathematical model is a
simplification of a real world
situation.
- Advantages of mathematical models
are they are quick and easy to
produce, they can simplify a more
complex situation, they can help us
improve our understanding of the real
world as certain variables can readily
be changed, they enable predictions to
be made about the future, they can
help provide control.
- Disadvantages of mathematical models
are they only give a partial description of
this real situation and they only work for a
restricted range of values.
- A mathematical model is a
simplification of a real world
situation.
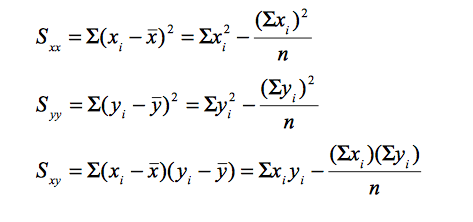
- Representation and summary of data
- CONTINUOUS
VARIABLE - a variable
that can take any value
in a given range
- Divide n by 2 and use
interpolation to find the
value of corresponding
term
- Divide n by 2 and use
interpolation to find the
value of corresponding
term
- DISCRETE VARIABLE
- is a variable that can
take only specific
values in a given range
- Divide n by 2, if the
answer is a whole number
find the mid point, if not,
round the number up
- Divide n by 2, if the
answer is a whole number
find the mid point, if not,
round the number up
- CONTINUOUS
VARIABLE - a variable
that can take any value
in a given range
- Measures of dispersion
- To find there standard
deviation, square root the
variance
- When you have coded data in order to find the uncoded answer
you do the reverse, however for standard deviation only
multiplication or division affects the answer not anything that has
been added or subtracted, where as when calculating the original
mean you have to do the opposite of both adding/subtracting and
multiplication/division
- To find there standard
deviation, square root the
variance
- Representation of data
- OUTLIER is an extreme value.
To find outliers use the
calculation: 1.5 X IQR and
subtract from lower and add
onto upper quartile
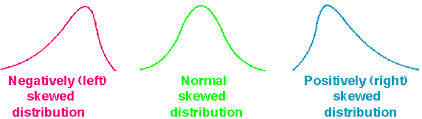
- To find the skew: 3(mean
- median) divided by
standard deviation,
median < mean = positive,
median > mean = negative
Q2 - Q1 < Q3 - Q2 =
positive, Q2 - Q1 > Q3 -
Q2 = negative
- OUTLIER is an extreme value.
To find outliers use the
calculation: 1.5 X IQR and
subtract from lower and add
onto upper quartile
- Probabilty
- A and B are independent if
P(A n B) = P(A) X P(B)
- A and B are mutually
exclusive P(A n B = 0)
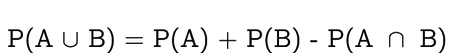
- Addition Rule
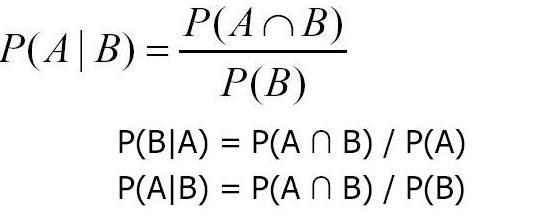
- Conditional Probability
- A and B are independent if
P(A n B) = P(A) X P(B)
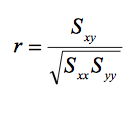
- Correlation
- The closer r is to 1, the closer it is to a
positive linear correlation
- r is never affected
by coding
- The closer r is to 1, the closer it is to a
positive linear correlation
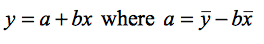
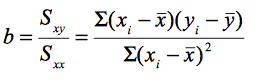
- Regression
- The sequence is
y = a + bx
- The regression of a coefficient
- The sequence is
y = a + bx
- Discrete Random Variables
- The sum of all the
probabilities must
add up to one ΣP
(X=x) = 1
- The expected
value of X
(mean) =
ΣxP(X=x)
- Variance of X
(VarX) = Σx2
P(X=x) then
minus the
mean squared
- For a discrete uniform
distribution you can
calculate the mean you do n
+ 1 divided by 2, and to
calculate the variance you
do (n+1) (n-1) divided by 12
- The sum of all the
probabilities must
add up to one ΣP
(X=x) = 1
- Normal distribution
- Z = X - mean / standard deviation
- Z = X - mean / standard deviation
Media attachments
Want to create your own Mind Maps for free with GoConqr? Learn more.