
Mind map
Class: Patterns of Victimisation
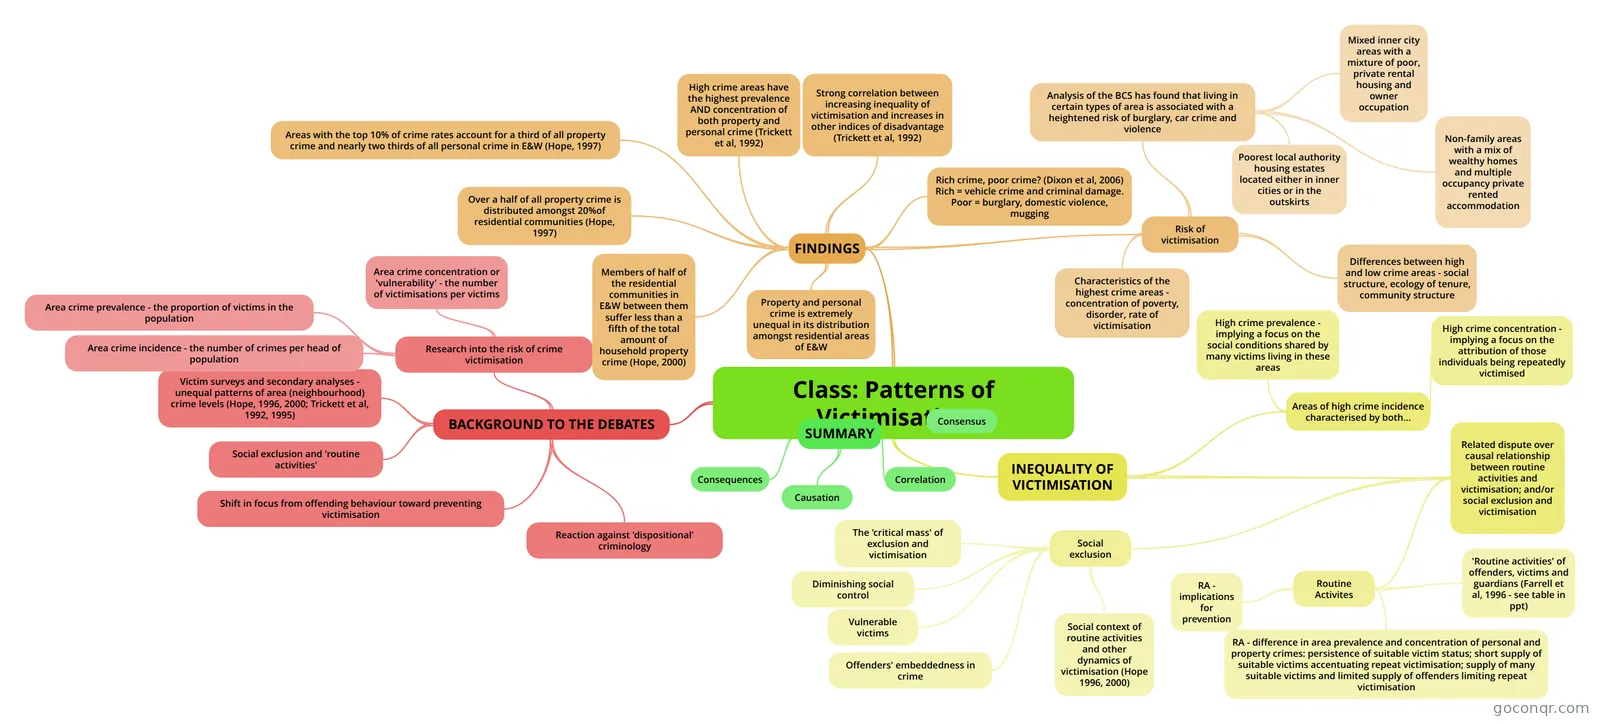
Mind map: Patterns of victimisation
Map content
Class: Patterns of Victimisation
BACKGROUND TO THE DEBATES
- Reaction against 'dispositional' criminology
- Shift in focus from offending behaviour toward preventing victimisation
- Social exclusion and 'routine activities'
- Victim surveys and secondary analyses - unequal patterns of area (neighbourhood) crime levels (Hope, 1996, 2000; Trickett et al, 1992, 1995)
- Research into the risk of crime victimisation
- Area crime incidence - the number of crimes per head of population
- Area crime prevalence - the proportion of victims in the population
- Area crime concentration or 'vulnerability' - the number of victimisations per victims
FINDINGS
- Property and personal crime is extremely unequal in its distribution amongst residential areas of E&W
- Members of half of the residential communities in E&W between them suffer less than a fifth of the total amount of household property crime (Hope, 2000)
- Over a half of all property crime is distributed amongst 20%of residential communities (Hope, 1997)
- Areas with the top 10% of crime rates account for a third of all property crime and nearly two thirds of all personal crime in E&W (Hope, 1997)
- High crime areas have the highest prevalence AND concentration of both property and personal crime (Trickett et al, 1992)
- Strong correlation between increasing inequality of victimisation and increases in other indices of disadvantage (Trickett et al, 1992)
- Rich crime, poor crime? (Dixon et al, 2006) Rich = vehicle crime and criminal damage. Poor = burglary, domestic violence, mugging
- Risk of victimisation
- Analysis of the BCS has found that living in certain types of area is associated with a heightened risk of burglary, car crime and violence
- Mixed inner city areas with a mixture of poor, private rental housing and owner occupation
- Non-family areas with a mix of wealthy homes and multiple occupancy private rented accommodation
- Poorest local authority housing estates located either in inner cities or in the outskirts
- Differences between high and low crime areas - social structure, ecology of tenure, community structure
- Characteristics of the highest crime areas - concentration of poverty, disorder, rate of victimisation
- Analysis of the BCS has found that living in certain types of area is associated with a heightened risk of burglary, car crime and violence
INEQUALITY OF VICTIMISATION
- Areas of high crime incidence characterised by both...
- High crime prevalence - implying a focus on the social conditions shared by many victims living in these areas
- High crime concentration - implying a focus on the attribution of those individuals being repeatedly victimised
- Related dispute over causal relationship between routine activities and victimisation; and/or social exclusion and victimisation
- Social exclusion
- Social context of routine activities and other dynamics of victimisation (Hope 1996, 2000)
- Offenders' embeddedness in crime
- Vulnerable victims
- Diminishing social control
- The 'critical mass' of exclusion and victimisation
- Routine Activites
- 'Routine activities' of offenders, victims and guardians (Farrell et al, 1996 - see table in ppt)
- RA - difference in area prevalence and concentration of personal and property crimes: persistence of suitable victim status; short supply of suitable victims accentuating repeat victimisation; supply of many suitable victims and limited supply of offenders limiting repeat victimisation
- RA - implications for prevention
- Social exclusion
- Areas of high crime incidence characterised by both...
SUMMARY
- Consensus
- Correlation
- Causation
- Consequences
Information
- Description
- Undergraduate Diversity, Crime and Criminal Justice (Class) Mind Map on Class: Patterns of Victimisation, created by Laura Phillips on 21/05/2014.
- Created by
- Laura Phillips
- Views
- 174
- Rating