
2782558
Description
Page 1
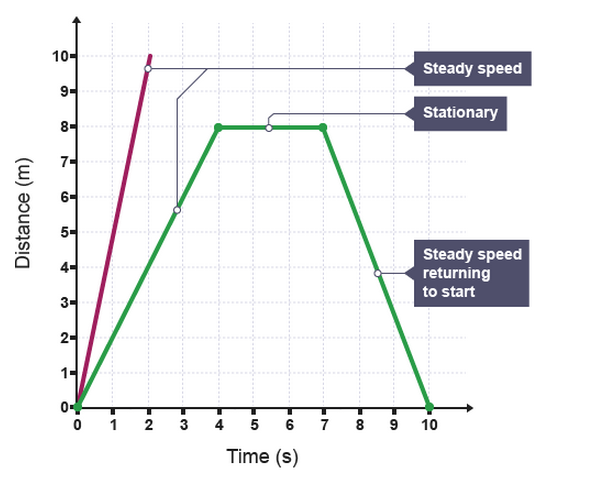
Distance Time Graphs show how far something travels over a certain period of time. The vertical axis shows the distance travelled from the start. The horizontal axis shows the time from the start.
When an object is stationary (not moving), the line on the graph is horizontal. When the object is moving at a steady speed, in a straight line, the line is straight but sloped.
Note the steeper the line, the faster the object is travelling. The purple line is steeper than the green line because the purple line represents which is moving more quickly.
0 comments
Want to create your own Notes for free with GoConqr? Learn more.