Description
|
|
Created by Inioluwa Ogun
almost 5 years ago
|
|
Page 1
Textbook: http://learningcentre.nelson.com/student/9780070973381/Student_Text/01_ML8_Chapter01.pdf
Page 2
Key Words: Interval = the spread between the smallest and the largest numbers in a range of numbers Bar Graph = Uses bars to represent data. Best for showing data for each category Line Graph = Uses dots & lines to represent data. Best for showing data over time Circle Graph = Uses sections & percents to show data. Best for showing data for each category in percent form Double Bar Graph = Uses 2 bars to represent data. Best for showing data for each category, from 2 different groups/people Double Line Graph = Uses 2 dots & lines to represent data. Best for showing data for 2 different groups/people Pictograph = Uses images to show data. Best for showing visuals in different categories Trend = a pattern in a set of results on a graph Distort = to change the appearance or twist the meaning of something in a way that is misleading
Page 3
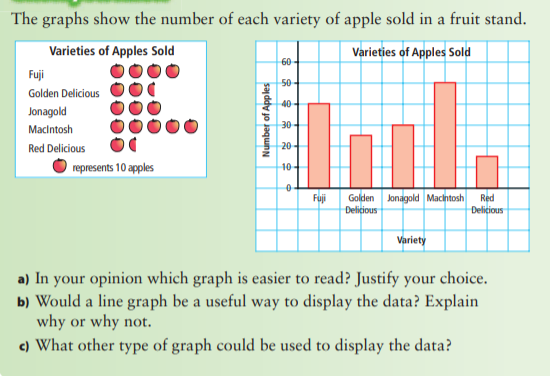
1.1 - Advantages and Disadvantages of Different Graphs Questions to help understand: What is an advantage of using a _____________________ (insert a type of graph) ? What is a disadvantage of using _____________________ (insert a type of graph) ? Which graph better shows the data? What are the best ways to display a large quantity of data?
Comparing 2 Graphs:
Page 4
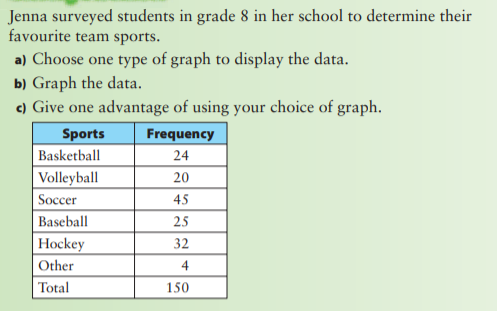
1.1 - Advantages and Disadvantages of Different Graphs (cont.) Questions to help understand: What type of graph would you use to display the data? Why would a _____________________ (insert a type of graph) be effective to display the data? Would a _____________________ (insert a type of graph) be effective to display the data? Why or why not?
Representing Data:
Page 5
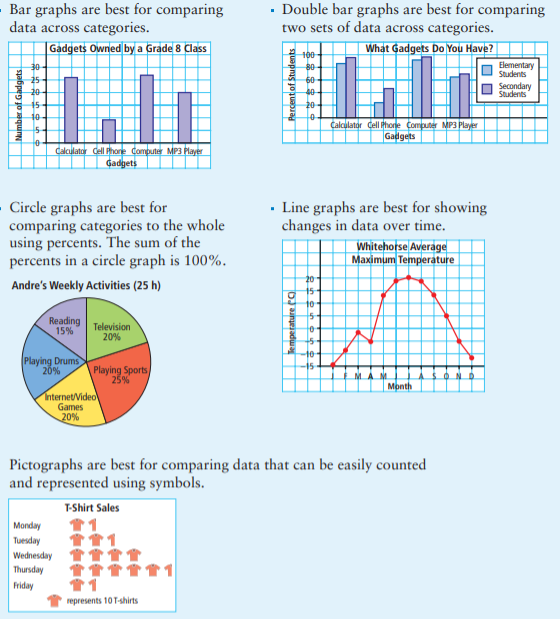
Key Ideas in 1.1 Data can be presented using bar graphs, double bar graphs, circle graphs, line graphs, and pictographs. Different graphs may provide different information and display certain types of data better.
Page 6
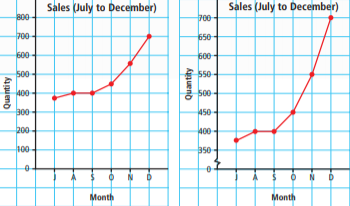
1.2 - Misrepresenting Data Questions to help understand: What are some ways to misrepresent data? How can the scale on a graph affect the conclusions someone might make about the data? How can you tell by looking at a graph if it has been distorted?
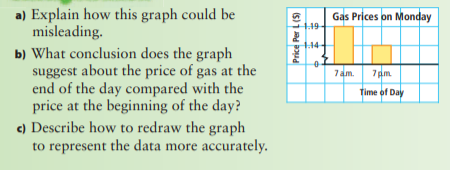
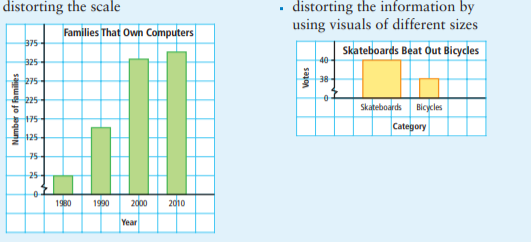
Distorting the Scale = Notice the break in the y-axis.
Page 7
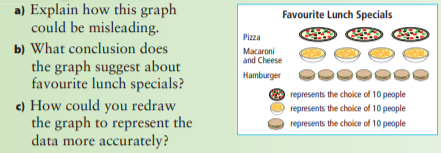
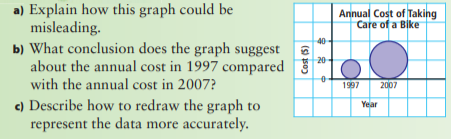
1.2 - Misrepresenting Data Distorting the Visuals = Notice that some of the images are bigger/wider OR smaller than others.
Distorting the Size of the Bars = Notice that one/some bars are wider OR smaller than others
Page 8
Key Ideas in 1.2 Misleading graphs can cause people to misinterpret the data and draw false conclusions. The format of a graph can be misleading.
Page 9
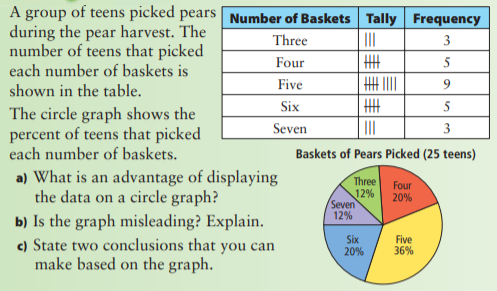
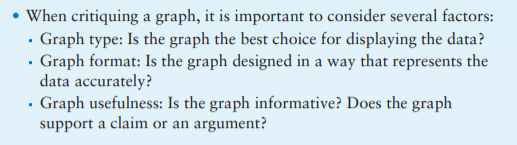
1.3 - Critiquing Data Presentation Questions to help understand: Does the graph represent what it says it does? What factors should you consider when you critique a graph? How can you make a graph easier to understand? What conclusions can you make from the graph?
Critiquing a Graph = You have to consider different factors.
Page 11
Make sure to do some practice questions!
Want to create your own Notes for free with GoConqr? Learn more.