Description
|
|
Created by Rahul Rudra
over 2 years ago
|
|
Page 1
Types of Machine Learning
Unsupervised ML
Only inputs are provided, and the machine groups the data of its own. Eg: grouping news article of same type, grouping customers into different market segments. Grouping can be done by: Clustering: Groups similar data points together Anomaly Detection: Find unusual data points. Dimensionality Reduction: Compress data using fewer numbers.
Supervised ML
Output and input both are provided to the machine and the machine trains to give output accordingly when some new input is fed. Eg : spam filter (spam or not spam), learning patients are diabetic or not, predicting price of land. The model can be trained via: Regression: The output can be infinite. Like the machine have to tell the price of a certain land which can be anything from 0 to infinity. Classification: The output is classified into categories like true or false, (0, 1 or 2).
Page 3
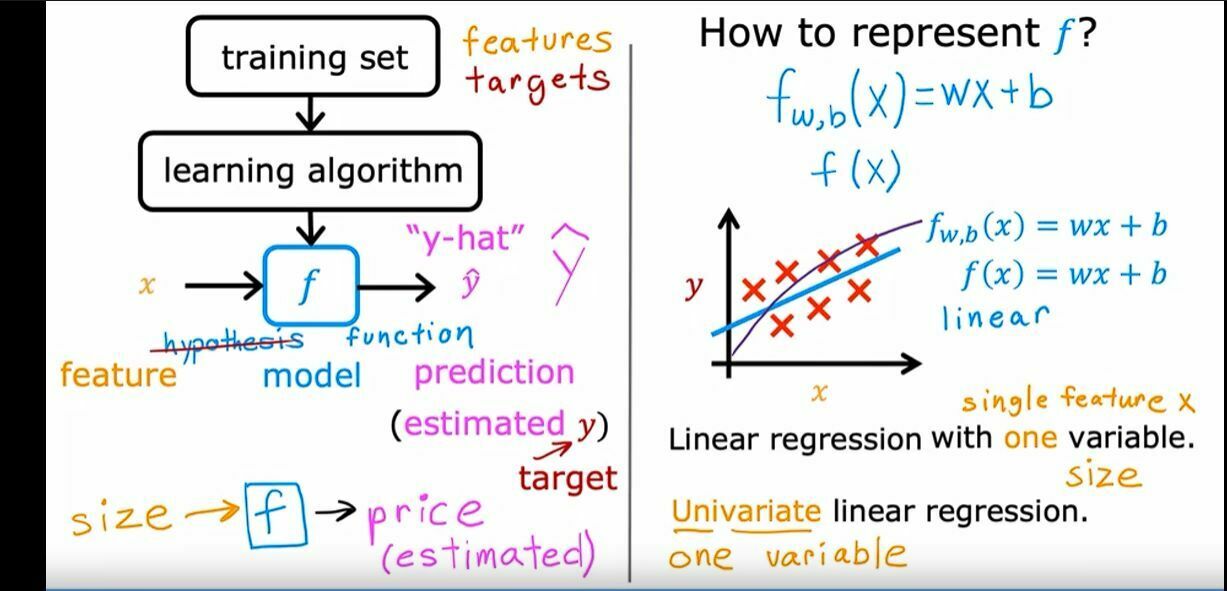
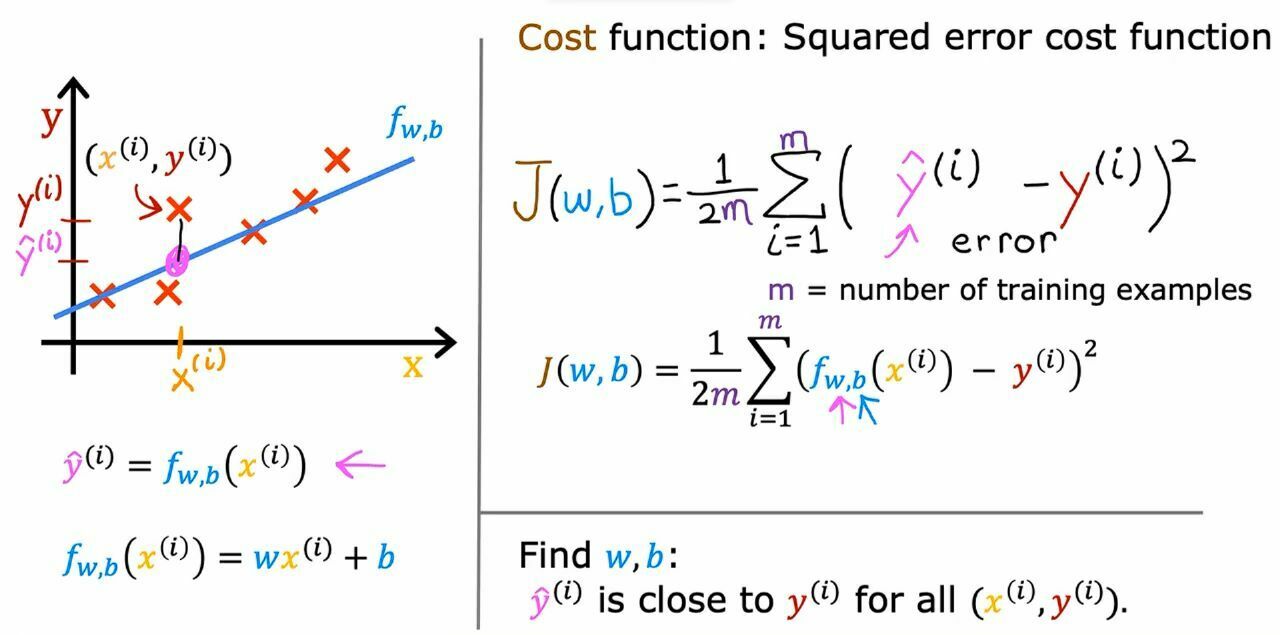
Cost Function
It is just a formula which is used to predict the values of w and b. It is denoted by J(w,b).
Page 4
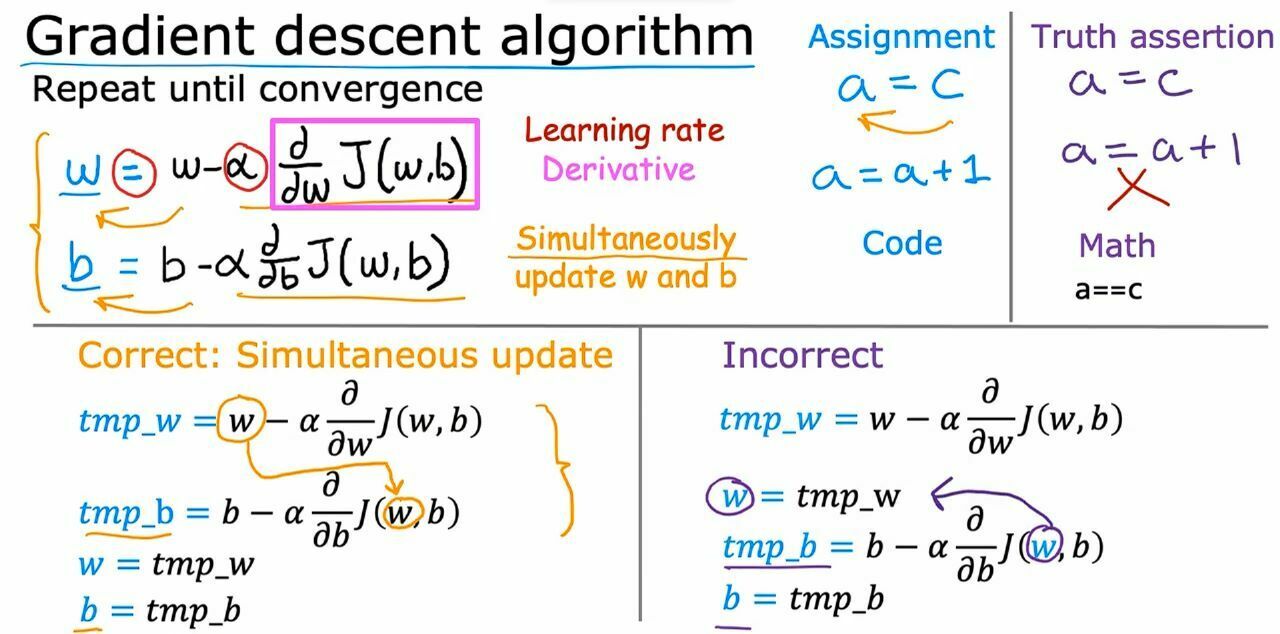
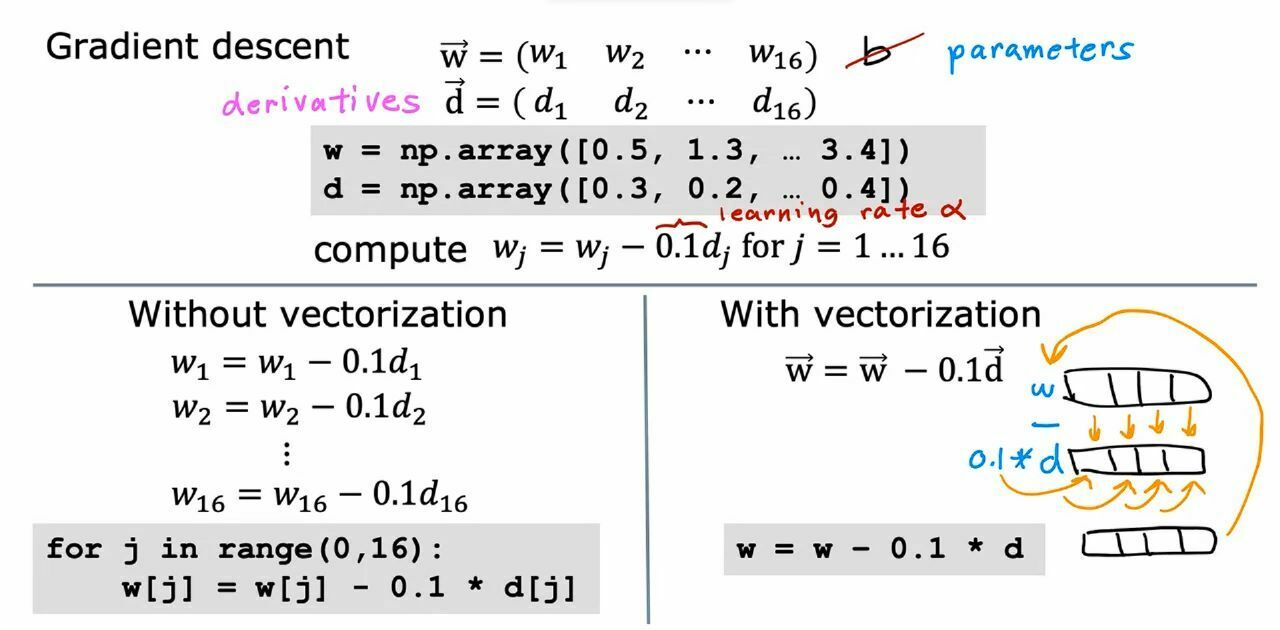
Gradient Decent Algorithm
In this algorithm w and b are decreased slowly till we get a zero derivate value for J(w,b) where the cost function is minimum.
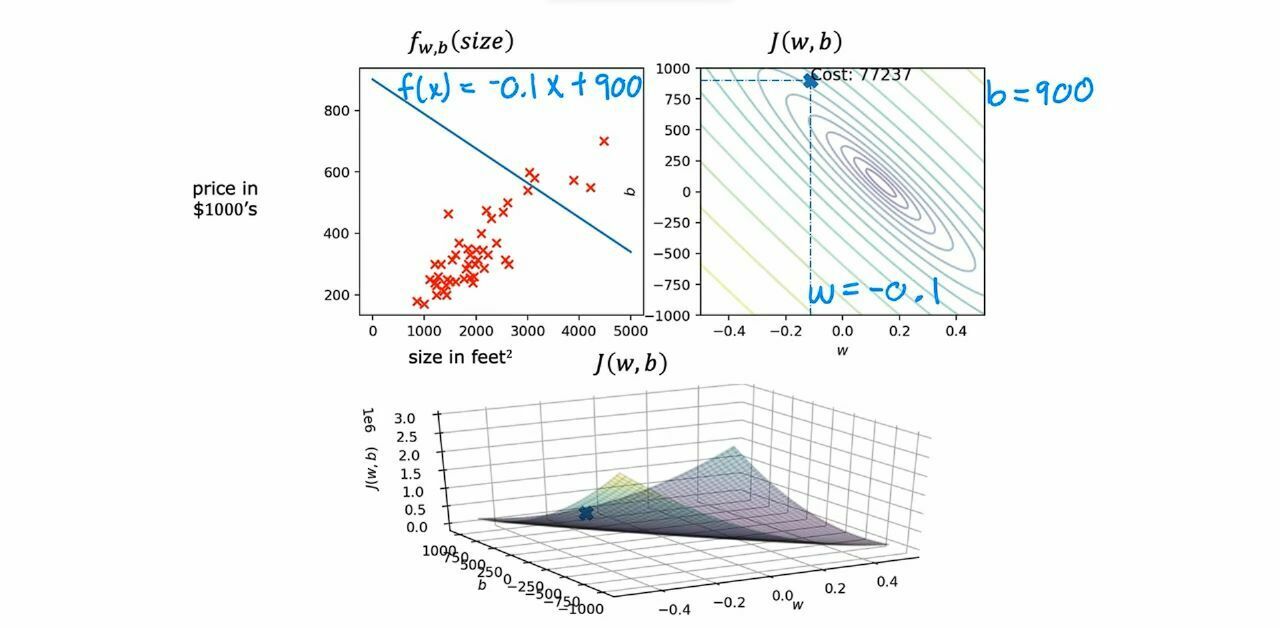
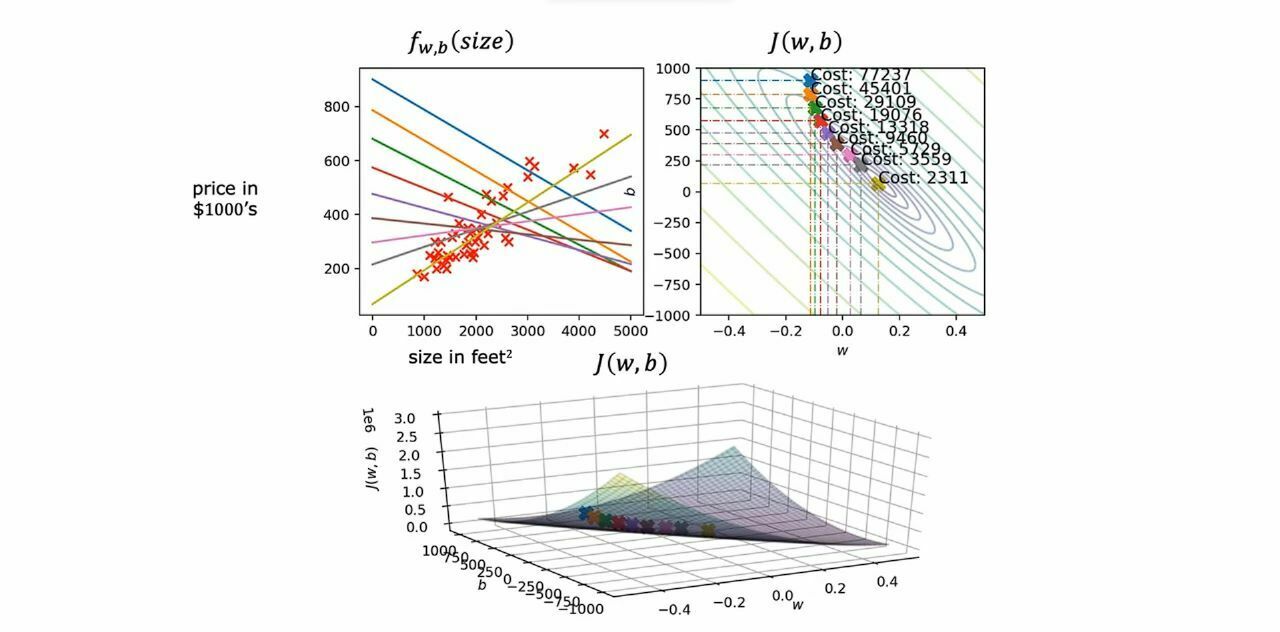
This is a cost function where 1st figure is of f(x) for w and b, second figure is for j(w,b) ,b and w and third figure is the same as previous but in 3-d.
Here you can see that how using different value of w and b we can plot different lines in first graph where the last yellow line represents the line with the minimum value of cost function .
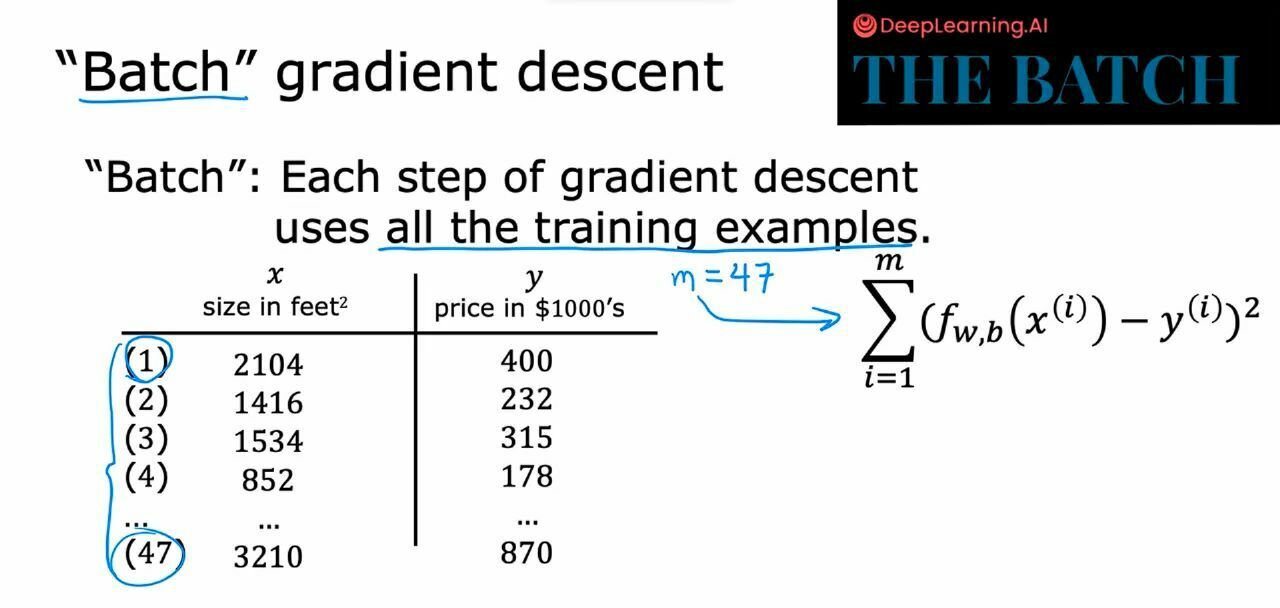
There are various methods to calculate w and b using gradient descent in which one them we are using for linear regression is batch gradient descent which uses all the datasets in every run to calculate w and b.
Page 5
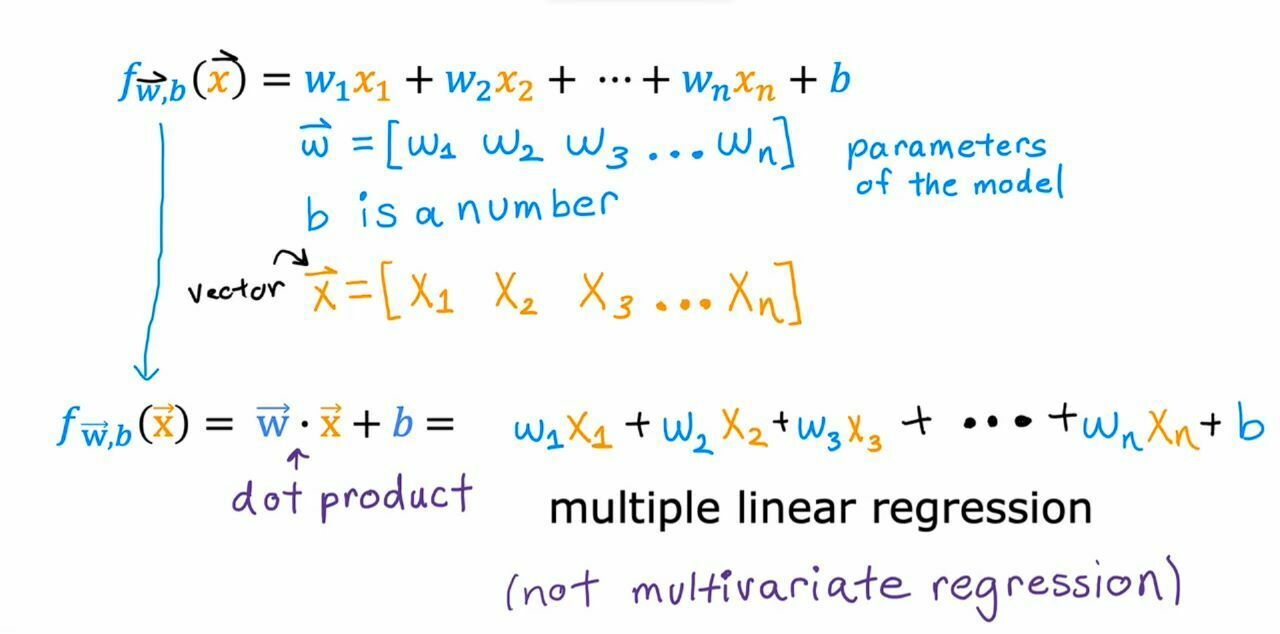
Multiple Linear Regression
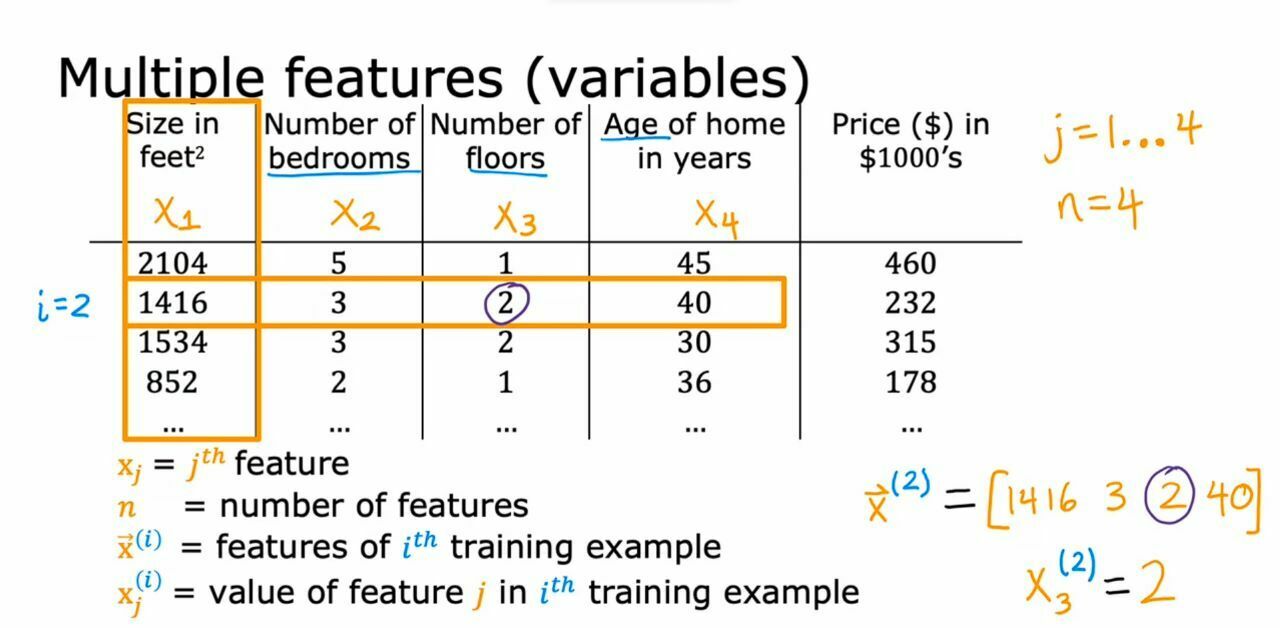
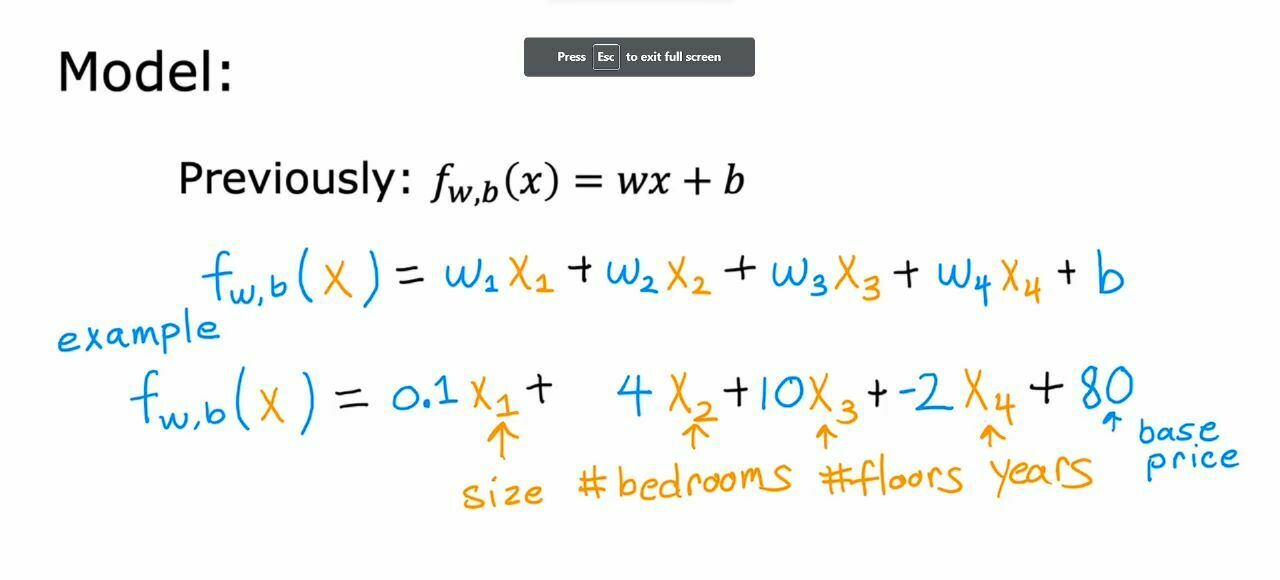
When there are multiple factors (inputs) affecting the output. For example, the price of a house can depend on the size of house, number of floors in house, age of house ,etc.
There are multiple w for multiple x so we have to calculate each single w's.
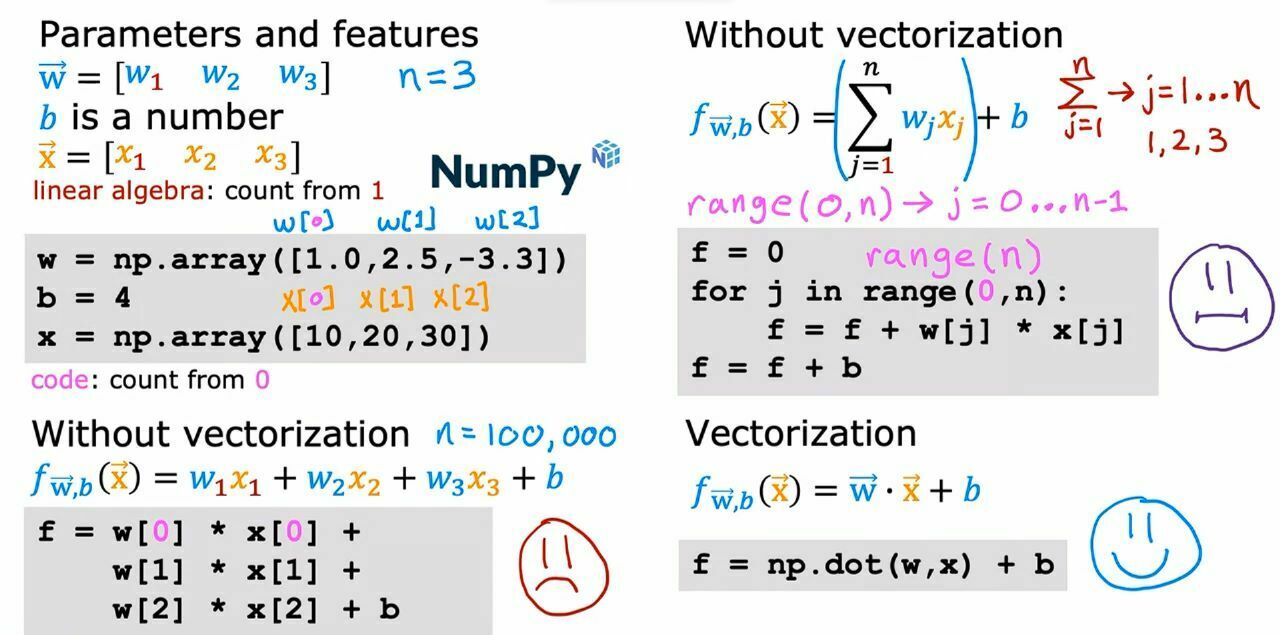
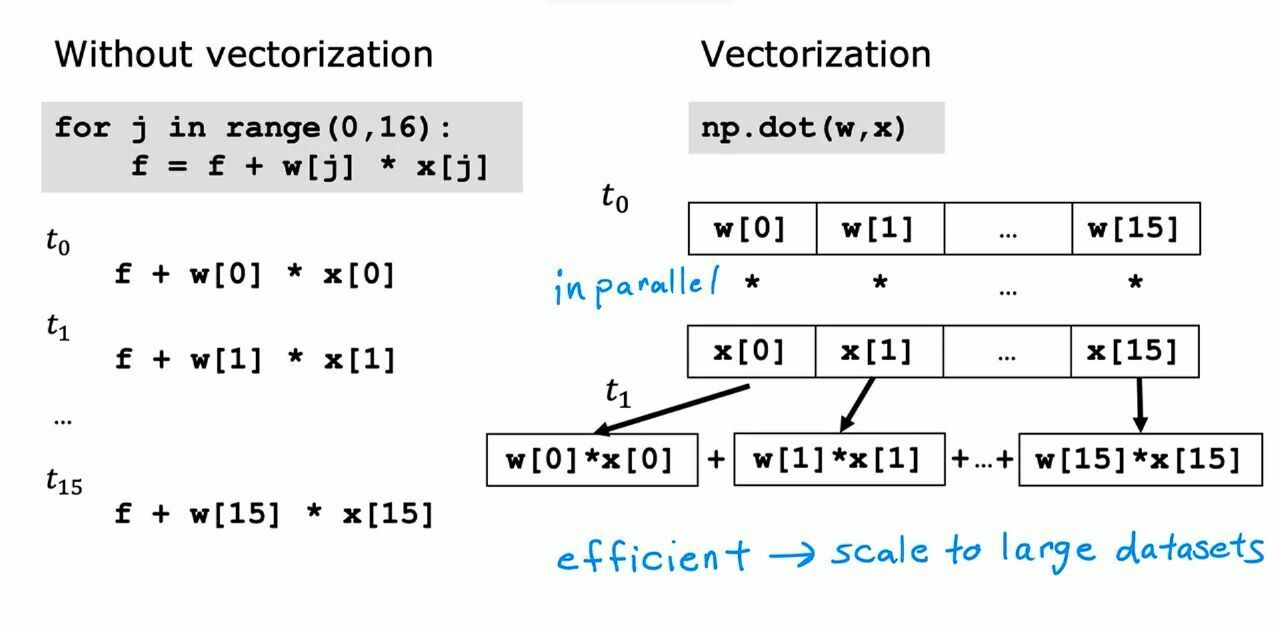
There are various ways to calculate f(x) but the best approach will be keeping values of w and x in a numpy array and using dot operation on them. Doing this takes a lot of less time. And this is called vectorization.
Page 6
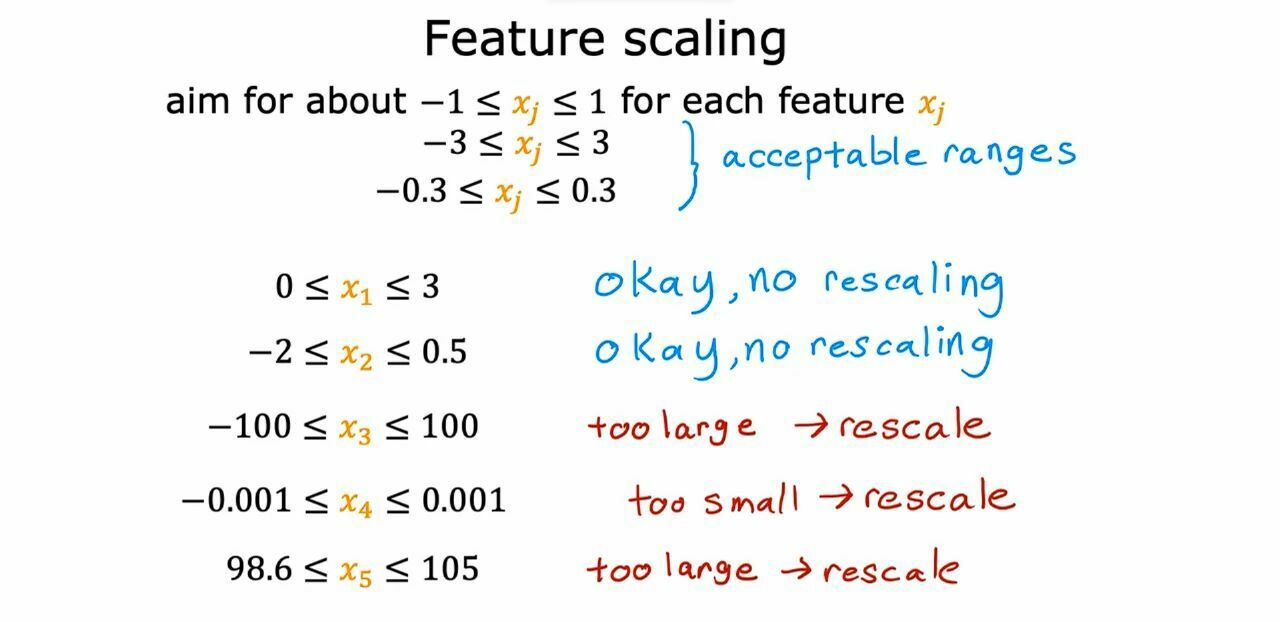
Feature Rescaling
In multiple regression, we can have different features for one specific data and the features values can have large ranges like if we have data like size and no of rooms then no of rooms will be maximum 4 or 5 but the size of land could thousands of sq feet. This variance in different features makes out gradient decent algorithm slow and to overcome this we do feature scaling. In this method we use different techniques to divide each feature with certain values and make them smaller.
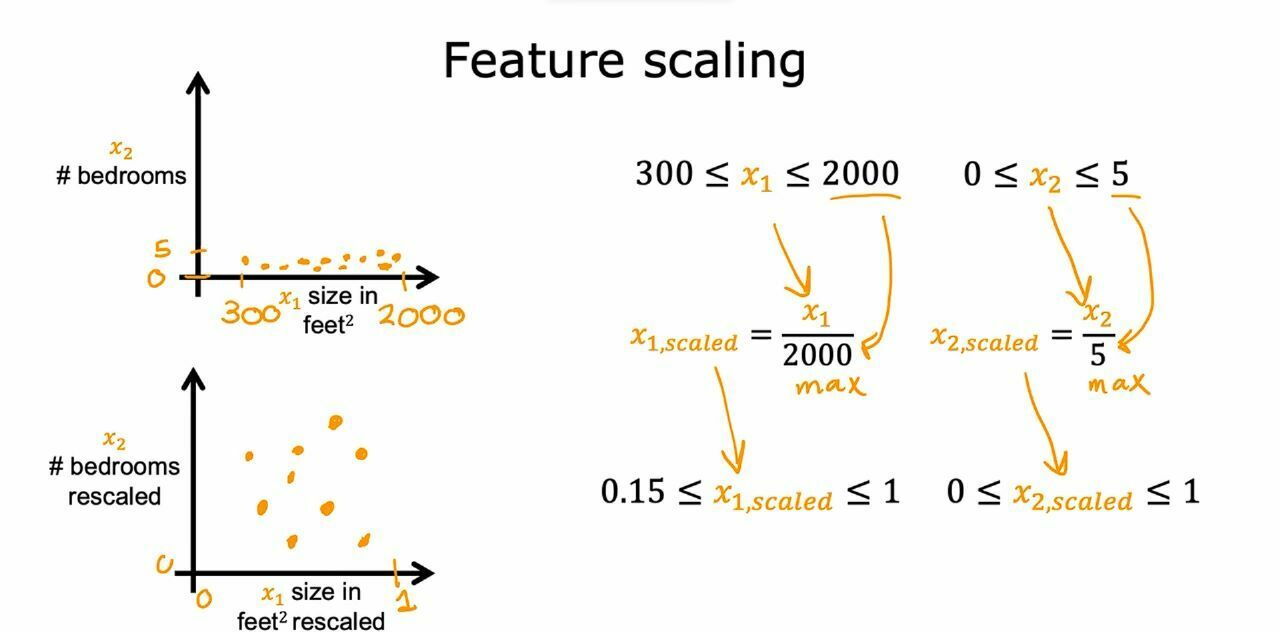
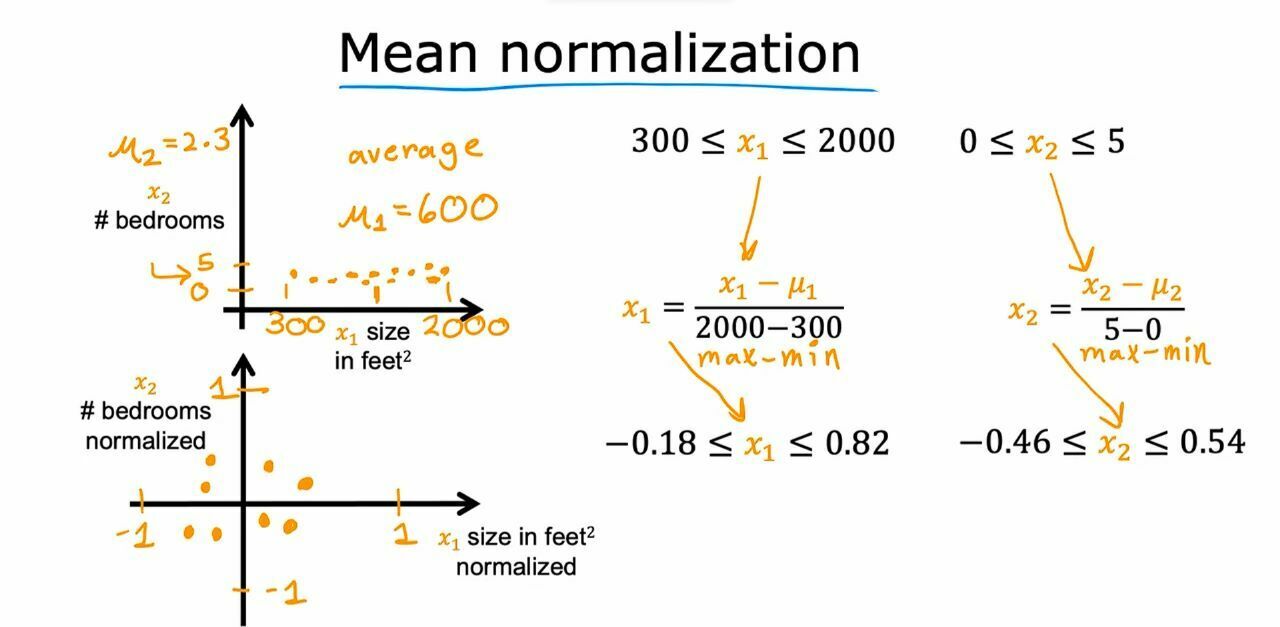
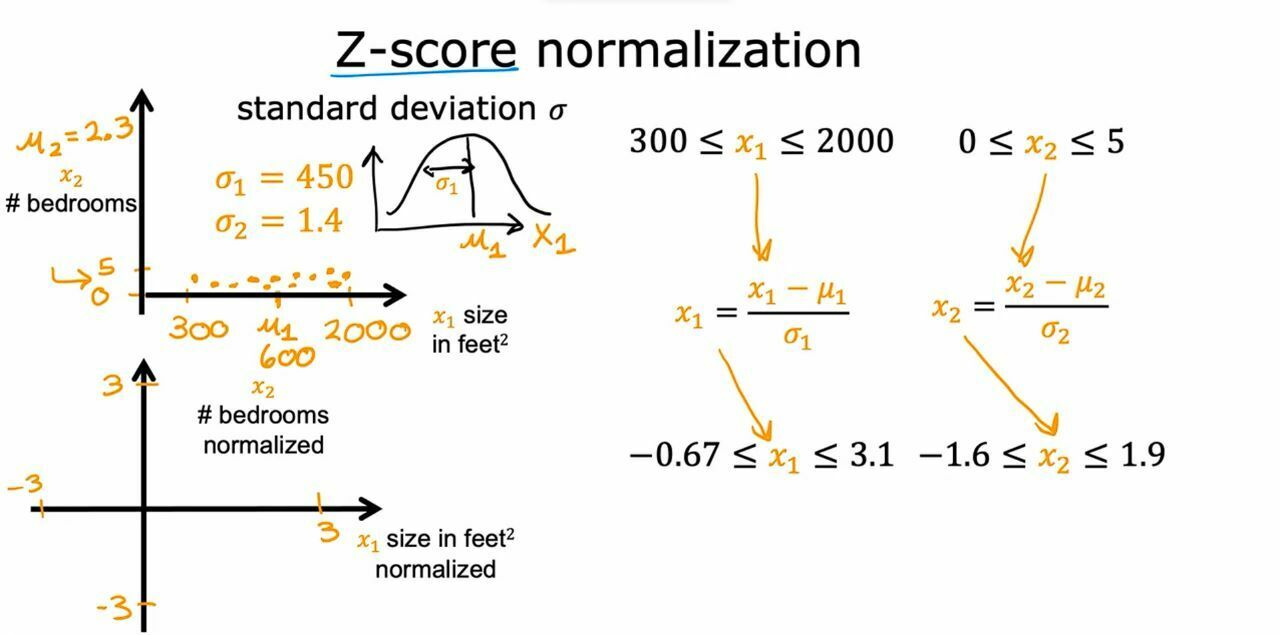
Different Ways of Feature Rescaling
Page 7
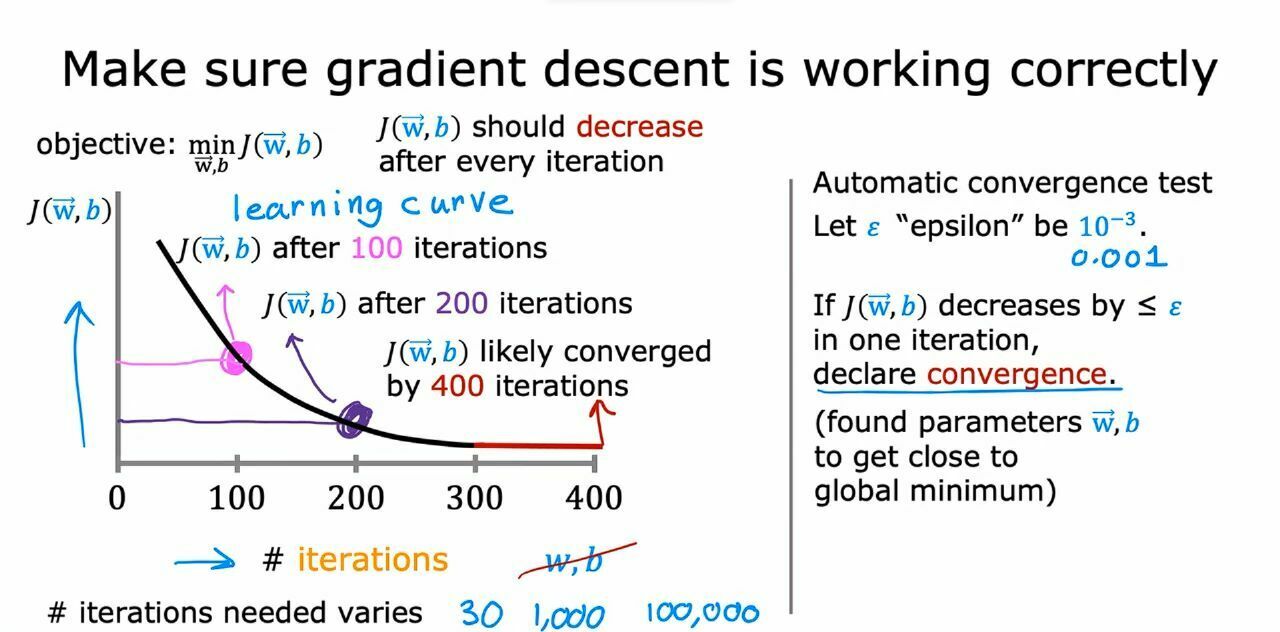
To know when to stop iterating we can make some graph like this which shows the value of J after each iteration so we can assume a value ε and if the value of J decreases less than or equal to ε we declare convergence.
Page 8
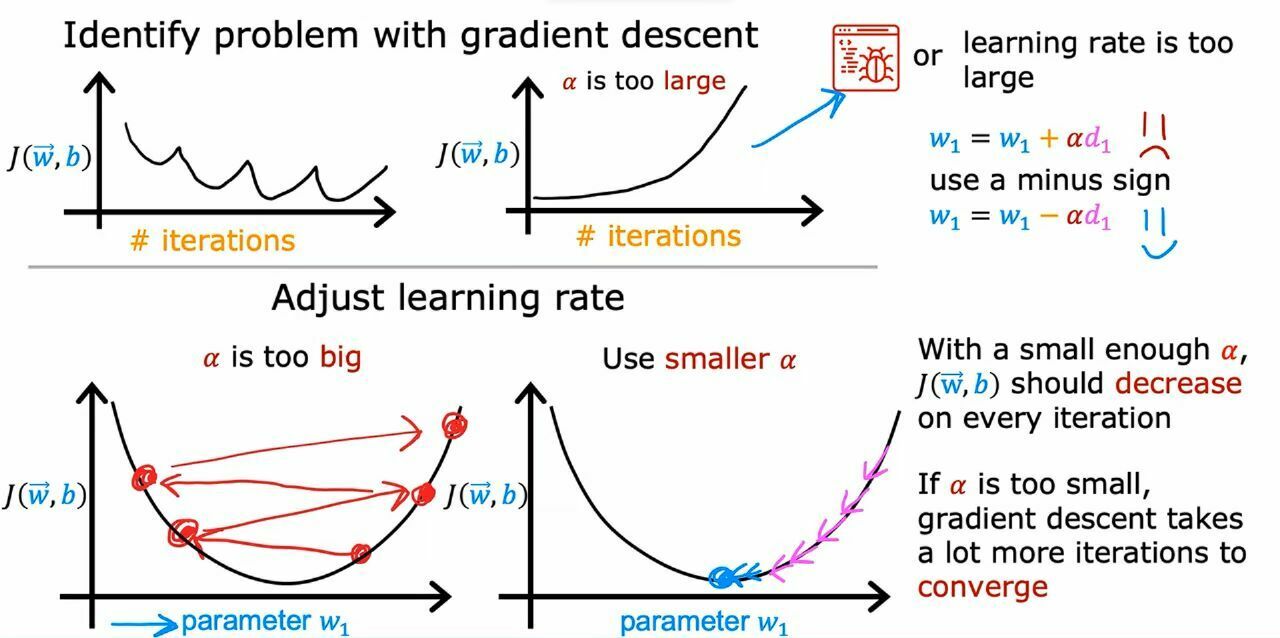
Sometimes the value of alpha may cause you problems in finding the values of w and b. This could occur because you choose a big value of because of which it is unable to converge at the lowest value of J and it could be swinging between other values. So, what we can do is decrease the value of alpha.
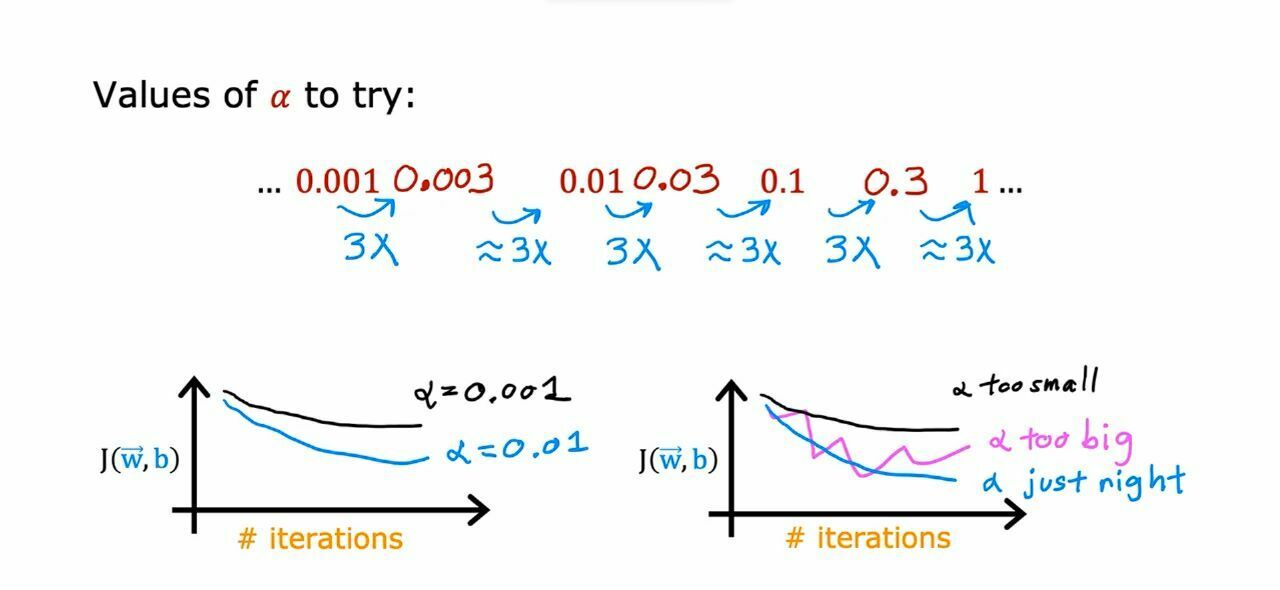
Also, if you choose a too small value of alpha, it will make our model slow. So, we can select a very small value of alpha and multiply it with some numbers till we get the right graph for J vs iterations.
Want to create your own Notes for free with GoConqr? Learn more.