
Description
Page 1
A function is an operation that takes one number and transforms it into another. It is only a function if every number in the domain goes to only one number in the range.The set of numbers you can start with is called the domain - the values of x can be entered into the function.The set of numbers you get out are called the range - the values of f(x) which come out of the function.Some functions take each value in the domain and give them a UNIQUE f(x) value; these are called one-to-one functions. Many-to-one functions mean that more than one value of the domain goes to the same value in the range. Some 'mappings' which aren't functions can be turned into functions by restricting the values that the domain can take, so that each value in the domain only goes to one value in the range, inverse trig functions are one example of this. Functions can be combined to make a composite function but the order is important fg(x) doesn't equal gf(x); fg(x) means do g(x) first then put the answer through f(x).The inverse of a function does the opposite to the function - ie. if you put the value of f(x) into the inverse you get back to the initial x value and is written as f−1(x). The domain and range are swapped so the domain of the function becomes the range of the inverse function and vice versa. Only one-to-one functions have inverses.To work out the inverse write the function as y = f(x), rearrange the equation to make x the subject. Replace x with f−1(x) and y with x and you have the inverse function. Swap around the domain and range.Graphically, the function and its inverse are reflections in the line y=x. Any points of intersection of the two graphs will also lie along this line.Modulus is a specific type of function which just gives the size of a number, the positive or negative doesn't matter, so the modulus of +6 is the same as the modulus of -6, it's 6.The modulus of a function means that any negative values of x become positive. To solve modulus equations sketch graphs to see how many solutions there are. If inequalities are involved, rewrite as two separate greater than or less than equations and solve. Transformations of graphs can be translations, stretches or reflections - and there's quite a bit to remember, but you can always refresh your memory using a table of values if you forget. The two possible translations are... y=f(x)+c this translates the function parallel to the y-axis - either up or down - so if c is 2 the graph moves up 2 spacesy=f(x+c) this translates the function parallel to the x-axis - either left or right - the graph moves the opposite way than you might expect - so if c is 2 the graph moves LEFT 2 spacesThe two possible stretches are...y=af(x) this stretches the function parallel to the y-axis - to make it taller or shorter - the x-axis intercept(s) remain the samey=f(ax) this stretches the function parallel to the x-axis by a factor of 1a - so the graph gets wider or slimmer, but does the opposite of what you might expect - the y-axis intercept remains the sameReflections are a special type of stretch if the scale factor a is negative... If the '-' sign is outside the function it reflects in the x-axis, if the '-' sign is inside the bracket it reflects in the y-axis. If more than one translation is happening, for example y=af(x+c) DO THE BIT IN THE BRACKETS FIRST! It does matter.An exponential function is of the form y=ax or y=a−x and they show exponential growth or decay - this can be used to model loads of real life situations for example the spread of disease or the growth of bacteria. You need to know what the graphs look like. The number e is a special value for which the gradient of the ex graph has the same value as ex at all points. As with normal logarithms the natural log. function, ln(x), is the inverse so if ex=4 then by 'logging' both sides you get that x=ln(4).As with all inverses the graph of ln(x) is the reflection of ex in the line y=x.The same log-laws from C2 apply...ln(a) + ln(b) = ln(ab) ln(ab)=ln(a)-ln(b) ln(xk) = kln(x)You may be asked to recognise or draw transformations of exponential or logarithmic graphs - the shape will always be the same so you need to find the points of intersection with the axis (by setting x and y equal to 0) and find asymptotes (by letting x or y tend to infinity).Because exponential growth and decay is good for modelling real life situations then you may be asked to read and interpret wordy questions in order to formulate and then solve an equation. The equation for exponential growth is:P=P0ekt P0 is the initial value and k is a constant (k will be negative if modelling exponential decay).
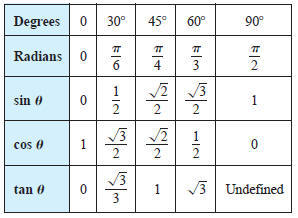
Sine, cosine and tangent are many-to-one functions (many values of x will give the same output value) for example, sine(90) = sine(450) = sine(810) ...Many-to-one functions don't have inverses, but if the domain is restricted then they can be made into one-to-one functions and then will have inverses (which are written as sin−1(x), cos−1(x) and tan−1(x) - this DOES NOT mean 1sin(x), 1cos(x) and 1tan(x). As with all inverse function graphs these are reflections of the original graphs in the line y=x.For inverse-sine and inverse-tangent restrict the domain to between -π2 and π2.For inverse-cosine restrict the domain to between 0 and π.You need to be able to sketch both the trig and inverse trig graphs. Cosecant, secant and cotangent are the reciprocals of the three main trig functions above - to remember which is which look at the 3rd letter, seCant is the reciprical of Cos. cosec(x)=1sin(x), sec(x)=1cos(x) and cot(x)=1tan(x)You need to be able to sketch these graphs aswell, using the original trig function might help...When the trig function equals 0, the reciprocal function is undefined, so will have an asymptote. When the trig function equals 1, the two functions will intersect - sec and cosec graphs also have minima at these points.There are 3 identities to learn (not in the formula book)...cos2θ + sin2θ = 11 + cot2θ = cosec2θ1 + tan2θ = sec2θThere are also addition formulae which can be used to find exact values of trig functions for an angle - these formulae are in the formula book but the table of values below is NOT. You could work this out using a right angled triangles but it's best to learn it.These addition formulae can be adapted into double angle formulae. The double angle formulae (which aren't in the Formula Book) can be used to changeexpressions in terms of sin or cos or tan of 2x back intosolveable 'x' term functions.
Algebra and Functions
Trigonometry
0 comments
Want to create your own Notes for free with GoConqr? Learn more.