
Page 1
1. Define speed A scalar quantity that refers to how fast an object is moving. 2. Calculate speed from total time total distance total time = 60s total distance = 20m average speed = .3333m/simportant to say average speed as the speed of a runner is not constant as it changes in the journey 3. Distinguish between speed and velocity speed = distance/time velocity = displacement/time Displacement: Distance measured in a given direction
Ways to measure speed:- stopwatch- ticker timer- light gate and card fixed to top of trolley
Time is always plotted on the X-axis (bottom of the graph). The further to the right on the axis, the longer the time from the start. Distance is plotted on the Y-axis (side of the graph). The higher up the graph, the further from the start.
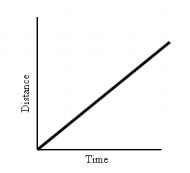
Time is increasing to the right, and distance is increasing constantly with time. The object moves at a constant speed. Constant speed is shown by straight lines on a graph.
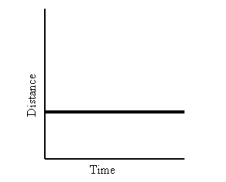
Time is increasing to the right, but its distance does not change. It is not moving. We say it is At Rest.
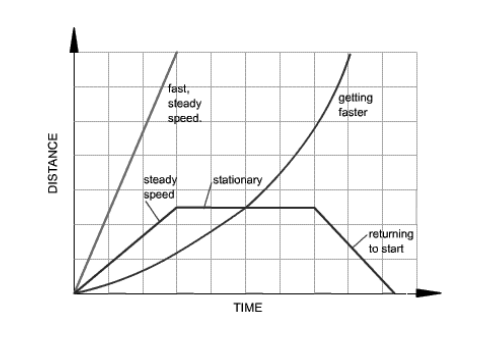
A steeper line indicates a larger distance moved in a given time. In other words, higher speed. Both lines are straight, so both speeds are constant.
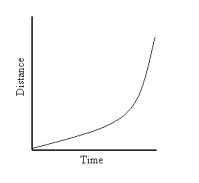
The line on this graph is curving upwards. This shows an increase in speed, since the line is getting steeper: In other words, in a given time, the distance the object moves is change (getting larger). It is accelerating.
Summary: A distance-time graph tells us how far an object has moved with time. • The steeper the graph, the faster the motion. • A horizontal line means the object is not changing its position - it is not moving, it is at rest. • A downward sloping line means the object is returning to the start
Whe
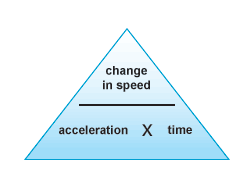
When an object moves faster and faster it acceleratesWhen it moves slower and slower, it deceleratesAcceleration: rate of change of speed
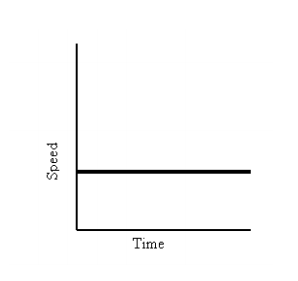
Speed-time graphs look a lot like distance-time graphs - read the labels!A straight horizontal line on a speed-time graph = constant speed (DOES NOT MEAN IT IS NOT MOVING)
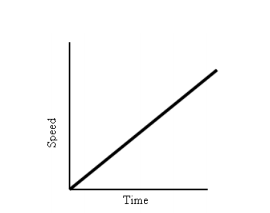
This graph shows increasing speed. The moving object is accelerating.
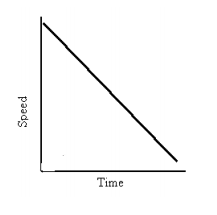
This graph shows decreasing speed. The moving object is decelerating
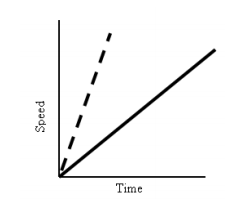
Both the dashed and solid line show increasing speed. Both lines reach the same top speed, but the solid one takes longer. The dashed line shows a greater acceleration.
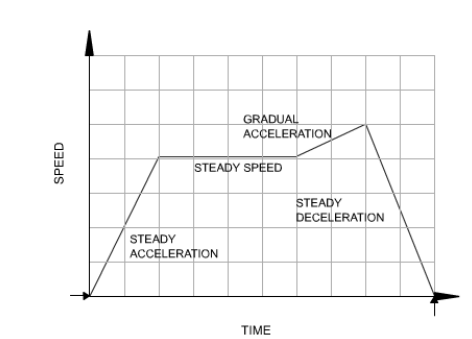
Summary: A speed - time graph shows us how the speed of a moving object changes with time. • The steeper the graph, the greater the acceleration. • A horizontal line means the object is moving at a constant speed. • A downward sloping line means the object is slowing down.
Dist
Distance = area under graphAcceleration = gradient of graph
d = 1/2at^2
Speed
Distance-Time Graphs
Acceleration
Speed-Time Graphs
Whiz Kids + Questions
0 comments
Want to create your own Notes for free with GoConqr? Learn more.