This note outlines distance-time graphs and velocity-time graphs. It can be used as a follow-on from the corresponding mind map "Linear Motion" or as a stand alone resource. It is aimed at a Leaving Certificate student, or someone who has an interest in graphs of linear motion.
Pinned to
632
2
0
No tags specified
|
|
Created by alex.examtime9373
over 11 years ago
|
|
Rate this resource by clicking on the stars below:


 (0)
(0)
Ratings (0)
| 0 | ||
| 0 | ||
| 0 | ||
| 0 | ||
| 0 |
0 comments
There are no comments, be the first and leave one below:
Close
451918
note
2016-11-22T00:31:25Z
1/1
Distance-Time Graphs
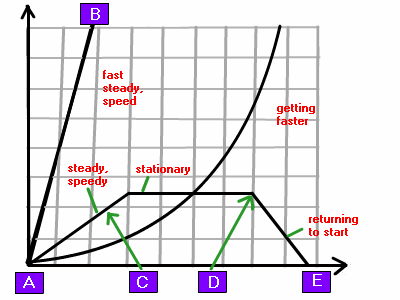
- Plotting a graph of distance from a given point against time can be useful in illustrating different types of motion

- The body starts moving from point A and moves towards point B very quickly
- The steeper the graph, the higher the slope, and the body is moving faster
- At point C it has a constant velocity
- Constant velocity means that the body has no acceleration
- A horizontal graph indicates that the body is stationary
- From point D to point E the body is returning to the start
Velocity-Time Graphs
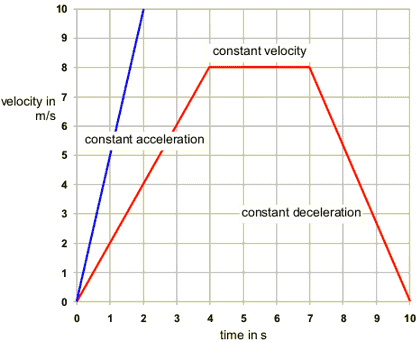
- We are interested in graphs that involve a constant acceleration throughout or ones where the acceleration changes instantly from one value to another
- The slope is equal to the velocity
- Slope = (y₂ - y₁)/(x₂ - x₁) = (s₂ - s₁)/(t₂ - t₁) = s/t = v
-
Time (in seconds) is plotted on the x-axis
- Distance (in metres) is plotted on the y-axis
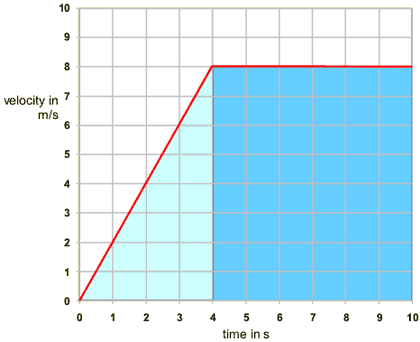
- Velocity (in metres per second) is plotted on the y-axis
- Time (in seconds) is plotted on the x-axis
- The slope is equal to the acceleration
- Slope = (y₂ - y₁)/(x₂ - x₁) = (v₂ - v₁)/(t₂ - t₁) = (v - u)/t = a
- The area under the graph is equal to the distance travelled
- Area = area of rectangle + area of triangle


New Page
