
Flashcards
Year 1 Stats Revision Notes
Flashcards do conjunto (65)
- 1Chapter 1 Data CollectionSummary Points
- 2Populationwhole set of items that are of interest
- 3Censusobserves or measures every member of the population
- 4Sampleselection of observations taken from a subset of the population used to find info about the population as a whole
- 5Sampling Unitsindividual units of a population
- 6Sampling framethe list of sampling units in named or numbered form
- 7simple random sampleone where every sample of size n has an even chance of being selected
- 8systematic samplingrequired elements are taken at regular intervals from an ordered list, eg. every 5th person
- 9stratified samplingpopulation is divided into mutually exclusive strata, eg. male and female, and a random sample is taken from each
- 10quota samplingan interviewer selects a sample that reflects the characteristics of the whole population
- 11opportunity samplingtaking the sample from people who are available at the time the study is carried out and who fit the criteria you are looking for
- 12quantitative data/variablesnumerical observations
- 13qualitative data/variablesnon-numerical observations, ie. words
- 14continuous variablea variable that can take any value in a given range, ie. height
- 15discreet variablea variable that can take only specific values in a given range, ie shoe size
- 16classesin grouped frequency tables, specific values are not shown, groups are called classes
- 17class boundariesmaximum and minimum values that belong in that class
- 18midpointaverage of the class boundaries
- 19class widthdifference between upper and lower class boundaries
- 20Chapter 2 Measures of location and spreadSummary points
- 21mode/modal classvalue that occurs the most
- 22medianmiddle value when data ordered, take an average if there are two values
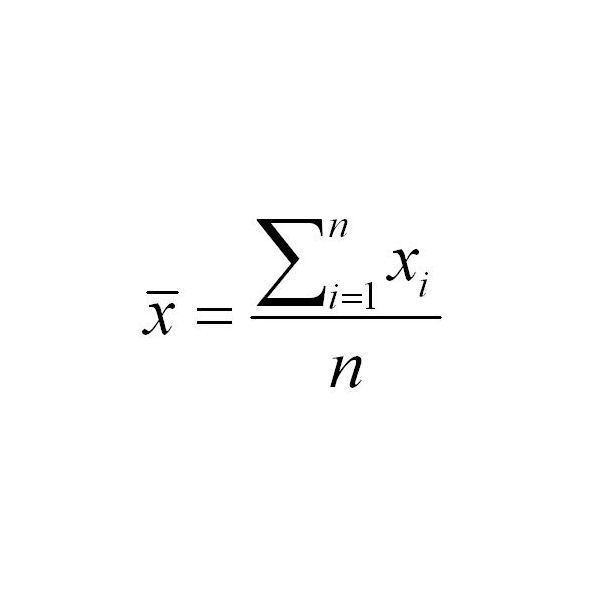
- 23mean
- 24for a mean in a frequency table
- 25lower quartile for discrete datadivide n by 4, if a whole number, Q1 is halfway between this data point and the next one up, if not round up and pick that point
- 26upper quartile for discreet datafind 3/4 n, if a whole number, Q3 is halfway between this data point and the next one up, if not round up and pick that point
- 27rangedifference between min and max value
- 28IQRQ3 - Q1
- 29Interpercentile rangedifference between the values for two given percentages
- 30Variancesee textbook p39
- 31Standard Deviationsquare root of variance
- 32Variance and Standard Deviation in a frequency tableSee textbook p39
- 33mean of coded datasee textbook p39, (do as coded formula says)
- 34standard deviation of coded datasee textbook p39, (only multiply divide, don't add or subtract)
- 35Chapter 3 Representations of dataSummary Points
- 36outliergreater than Q3 + k (IQR)
less than Q1 - k (IQR) - 37cleaning datathis is the process of removing anomalies from data
- 38frequency density (height of bar)on a histogram, area of bar = k x frequency
- 39frequency polygonformed by joining the middle of the top of each bar in a histogram with equal class widths
- 40comparing data setscomment on:
1 measure of spread
1 measure of location - 41Chapter 4 CorrelationSummary Points
- 42bivariate datadata has pairs of values for two variables
- 43Correlationdescribes linear relationship between two variables
- 44Regression linewritten in the form y = a + bx
- 45the coefficient btell you the change in y for each unit change in x, if positive correlation b is positive and vice versa
- 46Interpolation and Extrapolationonly use the regression line for interpolation, not extrapolation
- 47Chapter 5 ProbabilitySummary Points
- 48Venn diagramrepresents events graphically, frequencies or probabilities can be placed in a venn diagram
- 49mutually exclusive eventsP(A or B) = P(A) + P(B)
- 50independent eventsP(A and B) = P(A) x P(B)
- 51tree diagramused to show the outcomes of two (or more) events happening in succession
- 52Chapter 6 Statistical DistributionSummary Points
- 53Probability distributionfully describes probability of any outcome in the sample space
- 54sum of probabilitiessum of probabilities must always add up to 1
- 55Binomial distribution, B(n,p)X can be modelled with a Binomial Distribution if:
there are a fixed number of trials, n
there are only two possible outcomes
there is a fixed probability of success
the trials are independent of each other - 56probability mass functionsee page 97 for formula
- 57Chapter 7 Hypothesis TestingSummary Points
- 58Ho, null hypothesisassume this hypothesis to be correct
eg. Ho: p=0.7 - 59H1, alternate hypothesistells us about the parameter if assumption is shown to be wrong,
eg. H1: p>0.7 - 60One tailedwhere p< or p>
- 61Two tailedp is not equal to
- 62critical regionif the test statistic falls within this region reject H0 accept H1
- 63critical valuefirst value to fall inside of the critical region
remember for upper boundary it is 1 - P(x less than or equal to y), can be found using tables or calculator - 64actual significance levelprobability of an event happening by chance
- 65two-tailed testcritical region is split at either end of distribution, half significance level at end you are testing

Informações
- Descrição
- All revision notes from year 1 stats
- Criado por
- Tom Day
- Visualizações
- 24
- Tags
- Avaliação