
Flashcards
Econ Final
Flashcards do conjunto (59)
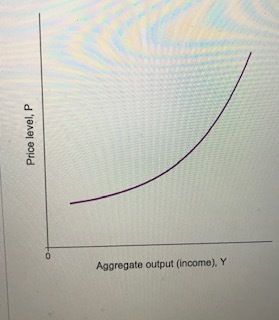
- 1—-The relationship between the price level and aggregate output (income) depicted in the figure to the right is known as the: aggregate supply curve
-The somewhat unique shape of the short run aggregate supply curve is based in part on how firms respond to an increase in aggregate demand. As firms and the economy move closer to full capacity, the response of firms is likely to change from: mainly increasing output to mainly increasing prices - 2—Using the three-point
curved line drawing tool, show how the following event will impact the economy's short-run aggregate supply (AS) curve. Properly label this curve.
Event: An accelerated national research and development program leads to a wave of technological advances.
ANSWER: AS curve shifts to the right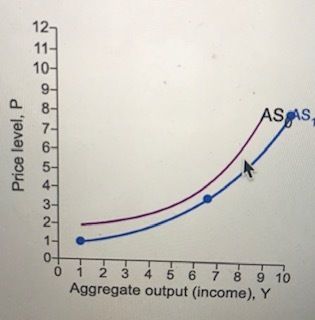
- 3—Some economists argue that the "animal spirits" of investors are so important in determining the level of investment in the economy that interest rates do not matter at all.
a. Suppose that this were true- that investment in no way depends on interest rates.
Using the line drawing tool, show what the investment curve would look like: VERTICAL LINE (in pic)
b. Under the above scenario, if the interest rate increased, planned investment and planned aggregate expenditures would: remain the same
c. Which of the following is incorrect if interest rates do not affect investment?
-fiscal policy would become less effective than monetary policy because the fiscal policy directly influences investment, which depends on the interest rates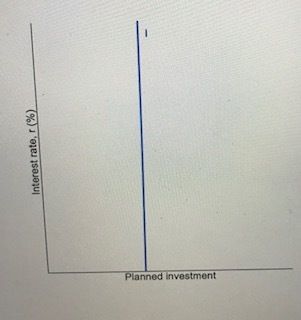
- 4—The figure to the right contains a point indicating the economy's initial price and aggregate output (P0, Y0) combination.
Suppose that the price level rises such that P1> P0.
1.) Using the point drawing tool, identify a potential location for the economy's new price and aggregate output (P1, Y1). Label this point B
2.) Using the line drawing tool, connect these points and properly label this line.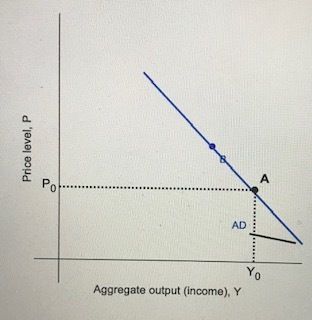
- 5—The figure to the right gives an economy's initial aggregate demand (AD) curve.
Using the line drawing tool, show a decrease in aggregate demand. Properly label this line: AD SHIFT LEFT
-Which of the following will generate a decrease in aggregate demand?
A TAX INCREASE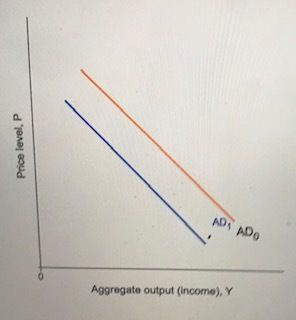
- 6—Suppose the economy portrayed by the figure to the right simultaneously experiences the cost shock of higher oil prices and a national security related surge in defense expenditures.
Manipulate both curves to derive the impact on the price level of these combined events.
NOTE: Shifts in AD require the line drawing tool while the three-point curved line drawing tool is used to shift AS. Properly label your new line and curve. (AS SHIFT LEFT AD SHIFT RIGHT)
-According to your graph, the price level: will ambiguously rise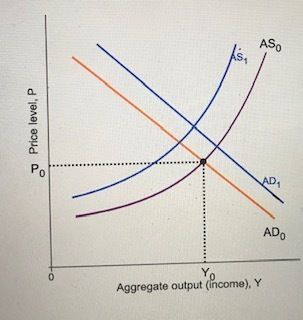
- 7—Suppose the economy portrayed by the figure to the right simultaneously experiences a surge of technological breakthroughs and a dramatic increase in household wealth.
Manipulate both curves to derive the impact on the price level of these combined events.
NOTE: Shifts in AD require the line
drawing tool while the three-point curved line drawing tool is used to shift AS. Properly label your new line and curve. (AS SHIFT RIGHT AD SHIFT RIGHT)
-A careful analysis of your graph leads to the conclusion that: the impact on the price level is indeterminate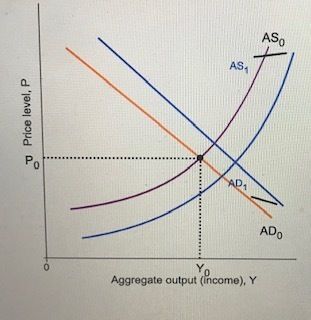
- 8—Refer to Figure-1 to the right. Consider an economy where the current GDP is higher than potential GDP. Assuming that input prices fully adjust to output prices after some lag. In the long run,
-wages and other input prices will rise, shifting the aggregate supply curve to the left to AS1
Figure-1 on the right shows an economy in a short run equilibrium with aggregate demand and supply curves intersecting at point 'A'. The aggregate supply curve shifts to the left due to the increase in wages and other input prices.
1.) Using the line drawing tool, show the impact of an increase in the money supply after the aggregate supply curve has partially adjusted toward long-run equilibrium but before the economy has actually reached the new long-run equlibrium.
Properly label this curve.
2.) Using the point drawing tool, identify the new equilibrium point and label it B. (AS LEFT, AD RIGHT)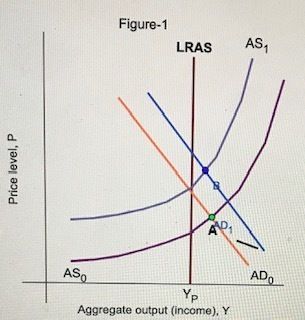
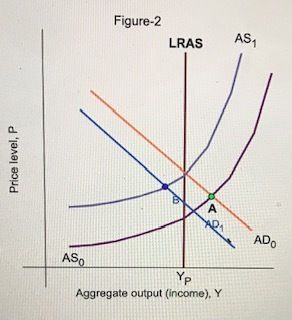
- 9—Figure-2 on the right, shows an economy in a short-run equilibrium with aggregate demand and supply curves intersecting at point 'A'. The aggregate supply curve shifts to the left due to the increase in wages and other input prices.
1.) Using the line drawing tool, show the impact of a decrease in government spending and in the money supply after the short-run aggregate supply curve has adjusted to long-run equlibrium.
Properly label this curve.
2.) Using the point drawing tool, identify the new equilibrium point and label it B.
(AS LEFT, AD LEFT)
- 10—Figure-3 on the right shows the aggregate demand and supply curves of an economy in a long run equilibrium at point 'A'. The aggregate supply curve shifts to the left due to an increase in oil prices.
1.) Using the line drawing tool, show the impact of an increase in money supply in order to accommodate the inflation. Properly label this curve.
2.) Using the point drawing tool, identify the new equilibrium point and label it B.
(AD RIGHT AS LEFT; EQUILIBRIUM POINT ON LRAS)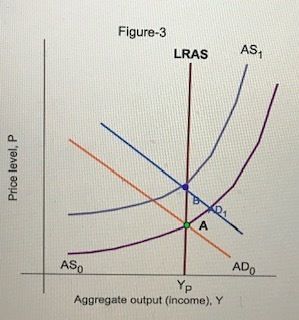
- 11—-The curve displayed in the figure to the right is known as the economy's: long-run aggregate supply
-The level of aggregate output (Y0) where the curve at right is drawn is called: potential output or potential GDP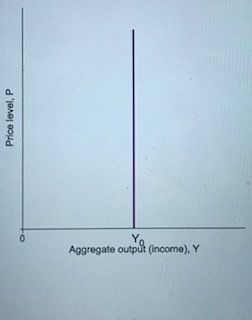
- 12—-The figure to the right shows an economy resting in equilibrium at its: potential output
-Using either the line drawing tool or the 3-point curved line drawing tool,
show the short run impact of an increase in planned aggregate expenditures. Properly label this line or curve. (AD right)
-Which of the following is likely to occur at the new short run equilibrium you've indicated: upward pressure on costs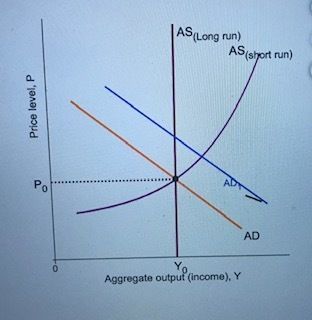
- 13—-The figure to the right shows the result of an increase in aggregate demand from AD0 to AD1. In its new short run equilibrium the economy is resting ABOVE it's potential output.
-Because the economy is producing beyond its potential output level, input prices and hence production costs are being pushed upward.
Using either the line drawing tool or the 3-point curved line drawing tool,
illustrate the impact of rising production costs. Properly label your new line or curve. (AS LEFT)
-According to your figure, the eventual long-run impact of the increase in aggregate demand is: higher prices, unchanged output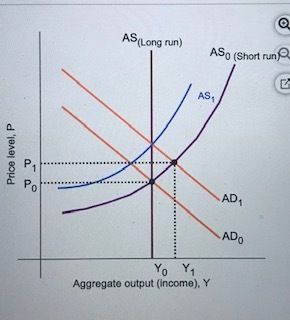
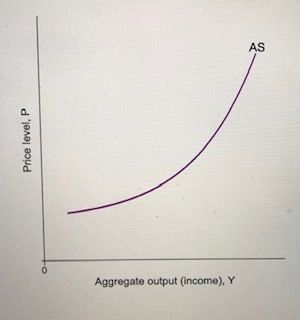
- 14—As shown in the diagram to the right, the short-run aggregate supply curve (AS) is upward-sloping. This positive slope is explained in part by the fact that: in the short-run, input prices- particularly wage rates- are slower to adjust to increasing aggregate demand than are output prices
- 15—The figure to the right shows the determination of the economy's short run equilibrium price level and aggregate output (income).
Draw a single line or curve (either AD or AS) such that a new equilibrium occurs with a lower price level and a higher output (income).
NOTE: Shifts in AD require the line
drawing tool while the three-point
curved line drawing tool is used to shift AS. Properly label your new line or curve. (AS SHIFT RIGHT)
-Which of the following events could have caused this particular change: a sharp increase in immigration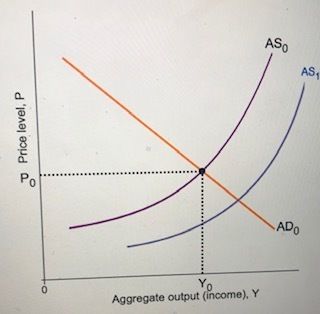
- 16—The figure to the right gives an economy's initial aggregate demand (AD) curve.
Using the line drawing tool, show an increase in aggregate demand. Properly label this line. (AD SHIFT RIGHT)
-Which of the following will generate an increase in aggregate demand: increased government expenditures for war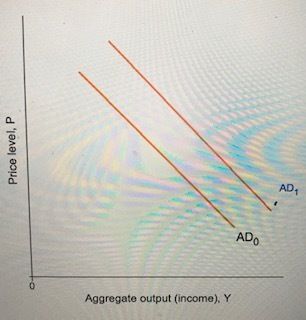
- 17—Using the three-point curved line drawing tool, show an increase in the economy's short run aggregate supply (AS). Properly label this curve. (AS SHIFT RIGHT)
-Which of the following events would NOT produce a rightward shift in the short-run AS curve: a significant decrease in the country's labor force participation rate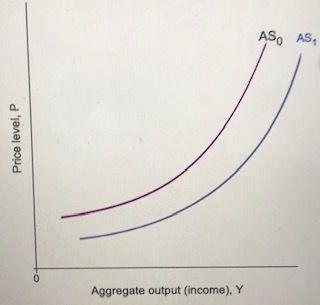
- 18—Using the three-point
curved line drawing tool, show how the following event will impact the economy's short-run aggregate supply (AS) curve. Properly label this curve.
Event: Upper A substantial increase occurs in the wages paid to workers. (AS SHIFT LEFT)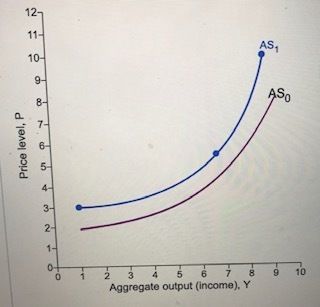
- 19—The figure to the right shows the economy initially in equilibrium at output Y0.
Suppose that the price level in the economy increases.
Using the line drawing tool, show the impact this increase has on the AE curve. Properly label this line AE1. (AE SHIFT LEFT TOUCHING Y AXIS)
According to your graph, the relationship between the price level and the level of aggregate output (income) is: negative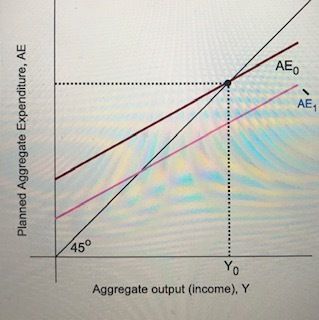
- 20—Given the following event:
Consumer and business optimism sharply increases.
Using the line
drawing tool or three
point curved line drawing tool, draw the appropriate object in the figure to the right to show the impact on the economy's short-run equilibrium price level and equilibrium aggregate output (income). Properly label this new line or curve. (AD SHIFT RIGHT)
-According to your graph, the short run result is that: both the price level and aggregate output (income) increase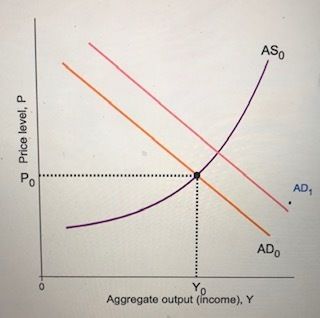
- 21—Figure 1 on the right shows an economy in an initial short-run equilibrium at point A.
1.) Using the line drawing tool, illustrate the impact of an increase in consumer confidence and business optimism with the economy operating at near full capacity. Properly label your line.
2.) Using the point drawing tool, identify the new equilibrium point. Label your point 'B'. (AD SHIFT RIGHT, EQUILIBRIUM POINT WHERE AD1 AND AS0 MEET)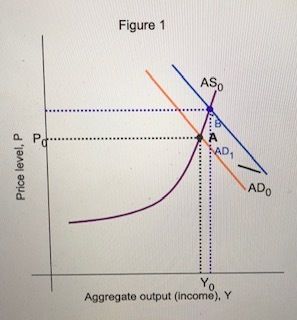
- 22—Figure 2 on the right shows an economy in an initial short-run equilibrium at point A.
1.) Using the line drawing tool, illustrate the impact of a tax cut holding government purchases constant with the economy operating well below full capacity. Properly label your line.
2.) Using the point drawing tool, identify the new equilibrium point. Label your point 'B'. (AD SHIFT RIGHT, EQUILIBRIUM WHERE AD1 AND AS0 MEET)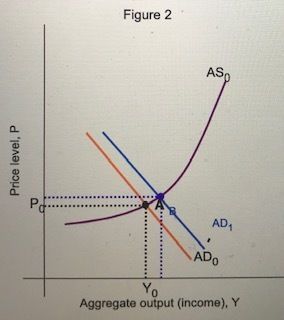
- 23—Figure 3 on the right shows an economy in an initial short-run equilibrium at point A.
1.) Using the line drawing tool, illustrate the impact of an increase in the money supply with the economy operating at near full capacity. Properly label your line.
2.) Using the point drawing tool, identify the new equilibrium point. Label your point 'B'. (AD SHIFT RIGHT, EQUILIBRIUM WHERE AD1 AND AS0 MEET)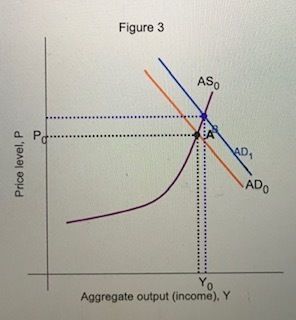
- 24—The Congress and the president raise income taxes while at the same time the Fed increases the money supply. The initial equilibrium in the money market, prior to any such policy change, is shown by the point E.
1.) Using the line drawing tool, show the possible impact of higher taxes. Properly label this line
2.) Using the line drawing tool, show the possible impact of the expansionary monetary policy. Properly label this line. (1. MD SHIFT LEFT 2. MS SHIFT RIGHT)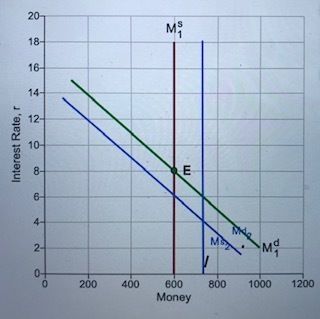
- 25—During 2009, the Federal Reserve was easing monetary policy in an attempt to boost the economy. That same year, Congress passed the American Recovery and Reinvestment Act that cut taxes and expanded existing tax credits for working families and businesses.
-As a result of this policy: GDP should increase and the interest rate should decrease
On January 1, 2013, the Social Security portion of the payroll tax rose from 4.2 percent to 6.2 percent and the top marginal tax rate increased to 39.6 percent from 35 percent. Assume the initial planned aggregate expenditure and interest rate were illustrated by AE1 with r equals 5 percent.
-Assuming that the Fed holds the money supply constant, which aggregate expenditure line and interest rate combination in Figure 1 illustrates the effect on aggregate expenditure, GDP, and the interest rate in 2013: AE5 with r=4%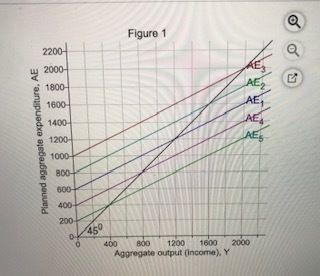
- 26—In 2014, the government raised taxes. At the same time, the Fed was pursuing an expansionary monetary policy. Assume the initial planned aggregate expenditure and interest rate were illustrated by AE1 with r equals 5 percent.
-Which aggregate expenditure line and interest rate combination in Figure 1 could result from this combination of fiscal and monetary policies in 2014: AE3 with r=4%
In January 2015, consumer confidence in the United States rose to its highest level since 2007, reflected by a rise in consumption. Assume the initial planned aggregate expenditure and interest rate were illustrated by AE1 with r equals 5 percent.
-Assuming that the Fed holds the money supply constant, which aggregate expenditure line and interest rate combination in Figure 1 shows the effect on aggregate expenditure, GDP, and the interest rate in 2015: AE2 with r=6% - 27—-What effects will an increase in the money supply with the economy operating at near full capacity have on GDP and the price level: the price level will increase significantly and GDP will increase very little
-What effects will a decrease in taxes and an increase in government spending supported by a cooperative Fed acting to keep output from rising have on GDP and the price level: the fiscal and monetary policies have opposing effects on the AD curve, therefore GDP and the price level will be unchanged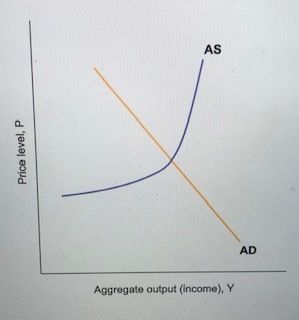
- 28—The figure to the right shows an economy in a short-run equilibrium at point A.
Using the three-point
curved line drawing tool, illustrate cost-push inflation. Properly label this curve. (AS SHIFT RIGHT)
-Which of the following is most likely to cause the cost shock that shifts the AS curve consistent with cost-push inflation: a surge in the price of crude oil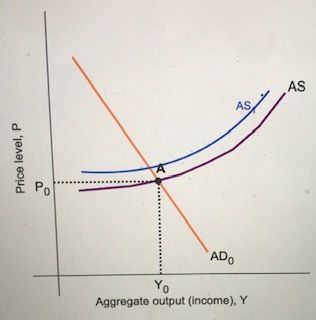
- 29—Suppose the economy depicted in the figure to the right experiences a surge in energy prices.
Using the three-point
curved line drawing tool or the line drawing tool, show the price/output consequences of this event. Properly label this curve. (AS SHIFT LEFT)
-If the economy's policymakers seek to reverse the output loss via the implementation of expansionary policies, the result will be: even higher prices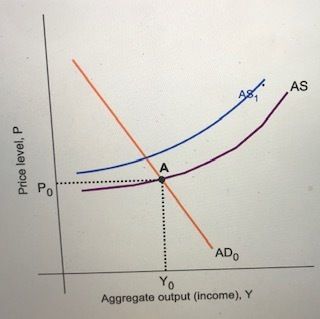
- 30—The figure to the right shows an economy in an initial short-run equilibrium at point A.
Using the line drawing tool, illustrate the impact of an contractionary demand-side policy. Properly label this line. (AD SHIFT LEFT)
-Which of the following best describes your diagram's depiction of the relative changes in aggregate output and the price level: both aggregate output and the price level decreased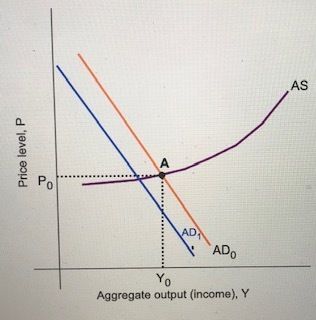
- 31—Using the AS/AD
graph, suppose the economy is currently at point A.
Which of the following would occur to return the economy back to its long-run equilibrium?
-wages would adjust upward, causing the short-run AS curve to shift to the left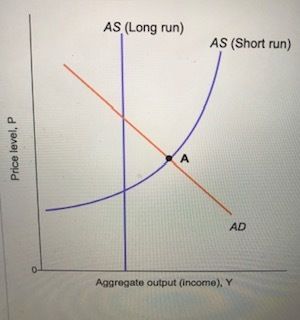
- 32—The figure to the right shows an economy in an initial short run equilibrium.
Using the line drawing tool, indicate the demand-side impact of expansionary fiscal policy. Properly label your new line. (AD SHIFT RIGHT)
-Which of the following best describes your diagram's depiction of the relative changes in aggregate output and the price level: aggregate output increased more than the level of prices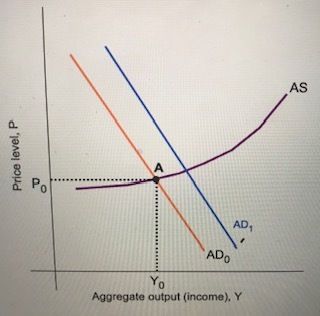
- 33—Related to the Economics in Practice:
A Bad Monsoon Season Fuels Indian Inflation
Using the line drawing tool, draw a line to show the effect the mild monsoon season had on the aggregate supply of rice in India. Properly label your line either AS1or AD1. (AS1 SHIFT LEFT)
-The mild monsoon season caused aggregate output to DECREASE and the price level to INCREASE in India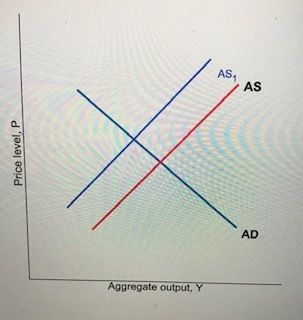
- 34—Consider the graph at right. The economy is initially in long-run equilibrium at point C
and there is an increase in corporate and personal taxes. Move the cursor on the graph at right to the new short-run equilibrium point. (POINT D)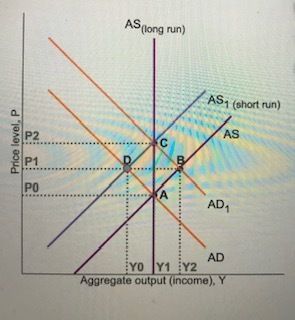
- 35—The figure to the right shows an economy experiencing a short run equilibrium at point A.
Using the line drawing tool, illustrate demand-pull inflation. Properly label this line. (AD SHIFT RIGHT)
-The magnitude of the inflation initiated by the change in aggregate demand depends upon: the slope of the AS curve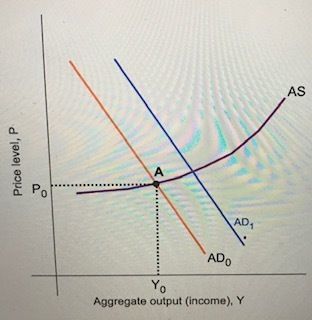
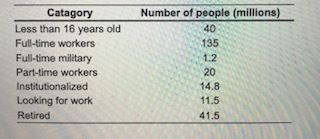
- 36—-Given the information in the table, how many people are in the labor force: 166.5 (full-time workers+part-time workers+looking for work)
-Given the information in the table, what is the labor force participation rate: 74.7% (labor force/labor force+retired+institutionalized)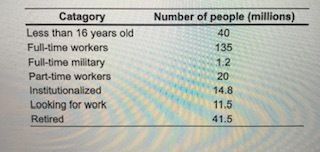
- 37—Assume the NAIRU inflation rate is 3 percent. Further assume that the unemployment rate is 2 percent below the NAIRU and stays there for many periods.
Using the NAIRU diagram on the right, after 3 periods the inflation rate is: 6 percent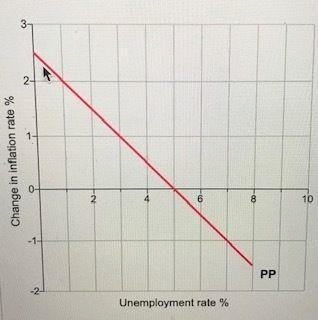
- 38—Given the information in the table, what is the unemployment rate: 6.9% (looking for work/labor force)
- 39—The Economics in Practice states that job applicants who have been unemployed for a long period of time have a more difficult time getting job interviews than do those applicants who have been unemployed for a shorter time period.
Analyze the unemployment data provided by FRED below.
-What happened to the "percent distribution" over that year for those who were unemployed 15 to 26 weeks and for those who were unemployed 26 weeks and over?
Percent distribution for unemployed 15 to 26 weeks: decreased
Percent distribution for unemployed 26 weeks and over: decreased
Does this data seem to support the findings in the Economics in Practice?
YES, the data does support the findings in the Economics in Practice because the percentage of long-term unemployed for 26 weeks and over is GREATER THAN the percentage of unemployed for 15 to 26 weeks during March of 2020.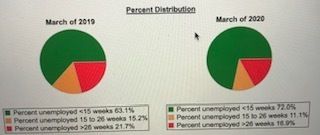
- 40—From 2003 to 2005 the stock market began to recover, but perhaps more importantly, the housing market boomed. As a result of this boom in housing, many homeowners saw the value of their homes soar. Many responded to this rise by taking out "home equity" loans, and then increasing their spending on consumer goods and services.
1.) Using the line drawing tool, illustrate this increase in consumer spending. Label the curve you draw "AE2".
2.) Using the point drawing tool, locate the new equilibrium output level in the economy. Label the point you draw "B". (AE SHIFT LEFT, EQUILIBRIUM WHERE AE2 AND 45% TOUCH)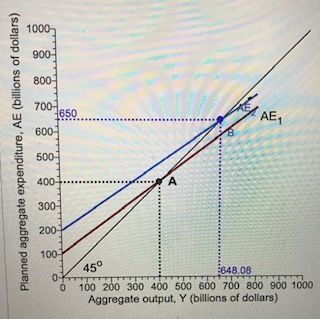
- 41—The unemployment rate and the duration of unemployment benefits for each of these countries are shown for 2007, prior to the recession of 2008minus
2009,
for 2010, the first full year following the end of the recession, and for June 2013, 4 years after the end of the recession.
As the data shows, three of these countries extended the duration of unemployment benefits as a result of the recession and two of those countries have since reduced the extended duration. The data for 2007, 2010, and 2013 show a positive relationship between the duration of unemployment benefits and the unemployment rate.
-Discuss whether a positive relationship still exists between the duration of unemployment benefits and the unemployment rate, and whether you believe the extension of unemployment benefits in three of those countries played a role in their current unemployment rates: the relationship is not conclusive between the duration of unemployment benefits and the unemployment rate because countries with no change in benefit periods still experienced an increase in the unemployment rat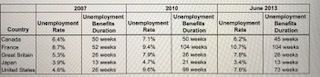
- 42—In 2015, the country of Sorbet was suffering from a period of high unemployment. The new president, Gelato, appointed Sherrie Sherbert as his chief economist. Ms. Sherbert and her staff estimated these supply and demand curves for labor from data obtained from the secretary of labor, Jerry Benjamin:
QD=100-5W
QS=15W-20
-quantity of labor supplied: 145 mil
-quantity of labor demanded: 100 mil
-unemployment rate: 69% (100/145)
President Gelato, over the objection of Secretary Benjamin, has recommended to Congress that the law be changed to allow the wage rate to be determined in the market. If such a law was passed and the market adjusted quickly, what would happen to total employment, the size of the labor force, and the unemployment rate?
-total employment: 70 mil
-size of labor force: 70 mil
-unemployment rate: 0
-Will the Sorbet labor market adjust quickly to such a change in the law: no, it will not adjust quickly due to social contracts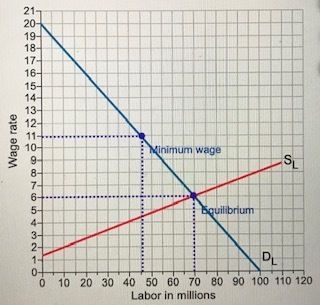
- 43—Use the graph on the right to show the predictions of Keynesian economic theory of the likely effects of a major tax cut when the economy is not operating at capacity and the Fed accommodates by increasing the money supply.
1.) Using the line drawing tool,
draw either a new aggregate demand curve or aggregate supply curve to demonstrate the event described above. Properly label your line. (AD SHIFT RIGHT)
Explain what happens to the level of real GDP and to the price level.
-As long as the economy is not operating at capacity, and as long as the Fed accommodates by increasing the money supply, a permanent tax cut can INCREASE the level of real GDP and is likely to INCREASE the price level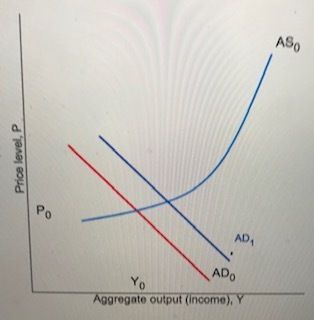
- 44—The table on the right gives estimates of the rate of the M2 money supply growth and the rate of real GDP growth for five countries in 2014.
-If you were a monetarist, you would predict the rate of inflation for Australia would INCREASE and the rate of inflation for the United Kingdom would DECREASE
-If you were a Keynesian and assuming activist central banks, you might argue that: increases in the money supply raise the demand for goods and services and stimulate the growth of real GDP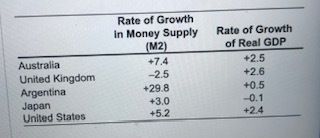
- 45—-Macroeconomists would find it difficult to test whether tax rates affect the supply of labor for Hibiscus because: tax rates have remained the same for all years data was collected
-Macroeconomists would find it difficult to test whether the inflation rate affects the unemployment rate for Hibiscus because: the unemployment rates have remained the same
-Macroeconomists would find it difficult to test whether the exchange rate affects the interest rate for Hibiscus because: exchange rates have fluctuated widely since 2010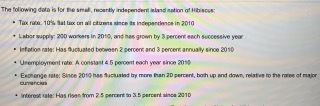
- 46—The United States and Brazil each produce only cheese and wine. Domestic prices are given in the following table:
On April 1, the London exchange listed an exchange rate of $1 = 1 BRL.
According to the table, ONE CAN'T DETERMINE FROM THE INFO GIVEN WHICH COUNTRY has absolute advantage in cheese or wine
-BRAZIL has a comparative adv in cheese
-USA has a comparative adv in wine
If the United States and Brazil were the only two countries engaging in trade, what adjustments would you predict assuming exchange rates are freely determined by the laws of supply and demand?
Relative to the Brazilian real, the dollar will BECOME WEAKER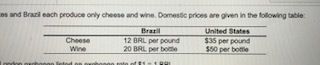
- 47—Great Britain and the United States produce cheddar cheese and blue cheese. Current domestic prices per pound for each type of cheese are given in the following table:
Suppose the exchange rate is £1
= $1.
-If the price ratios within each country reflect resource use, GREAT BRITAIN has comparative adv in production of cheddar
-UNITED STATES has comparative adv in blue cheese
Assume there are no other trading partners and that the only motive for holding foreign currency is to buy foreign goods.
Explain whether the current exchange rate will lead to trade flows in both directions between the two countries: cheddar cheese and bleu cheese will be purchased in Great Britain and sold in the United States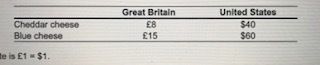
- 48—The graph on the right represents the domestic supply and demand for coal a number of years ago.
-in absence of trade, the equilibrium price is 1.75 and equilibrium quantity is 125
The government opens the market to free trade, and Indonesia enters the market, pricing coal at $1 per ton.
-the domestic price of coal will now be 1
-new QS will be 50 mil and QD will be 200 mil
-the amount of coal imported from Indonesia will be 150 mil
After numerous complaints from domestic coal producers, the government imposes a $0.50 per ton tariff on all imported coal.
-price will now be 1.50
-new QS will be 100 mil and QD will be 150 mil
-amount of coal imported is 50 mil
-gov will receive $25 mil in revenue from the $0.50 tariff (0.5x50)
-The $0.50 tariff is ultimately paid by: consumers of coal since the price rises by an amount equal to the tariff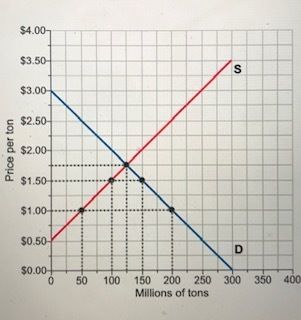
- 49—The domestic market for video games is shown in the diagram to the right. Currently the world price of video games is $15 per unit.
-the equilibrium price in the domestic market if there is no possibility of trade is $25
-at the world price, the quantity supplied by domestic firms is 16 units
-at the world price, the quantity demanded by domestic consumers is 70 units
-at this world price imports equal to 54 units (70-16)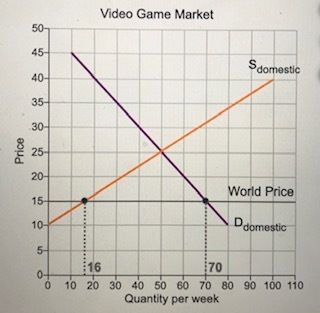
- 50—The domestic market for video games is shown in the diagram to the right. Currently the world price of video games is $15 per unit.
1.) Ust the line drawing tool to represent the imposition of a $5 tariff in this market. Label this line: 'WP + tariff'.
2.) Use the rectangle drawing tool to identify the level of revenue generated by this tariff. Label the rectangle 'revenue'.
(1. HORIZONTAL LINE 5 ABOVE THE ORIGINAL PRICE
2. DRAW RECTANGLE WHERE LINES INTERSECT WITH SUPPLY AND DEMAND LINES)
-The dollar amount of this tariff revenue is roughly $135 (60-33x5, the 60 and 33 are QD and QS at the tariff horizontal line)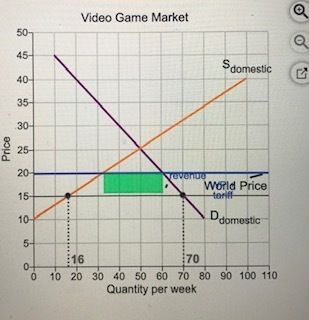
- 51—The figure traces the path of tariffs across the world from 1980 to 2005. The lines show an index of trade openness, calculated as 100 minus the tariff rate. (So higher numbers mean lower tariffs.)
-Which of the following best describes the openness of trade between 1980 and 2005: there was a trend toward more openness and fewer barriers to trade over time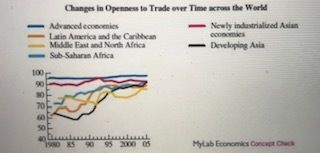
- 52—Suppose an importing country faces a free-trade price of $2 per unit. It then decides to impose a $1 per unit tariff on all imports.
Given this information, determine whether the tariff generates a gain or a loss for each of the following groups:
-domestic producers (producer surplus): gain
-domestic consumers (consumer surplus): loss
-domestic government (revenue): gain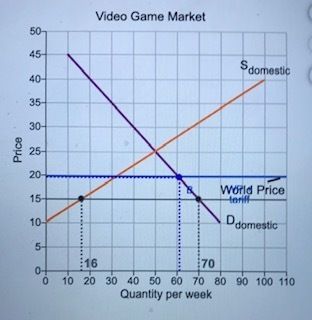
- 53—The domestic market for video games is shown in the diagram to the right. Currently the world price of video games is $15 per unit.
1.) Use the line drawing tool to represent the imposition of a $5 tariff in this market. Label this line: 'WP + tariff'.
2.) Use the point drawing tool to identify the new level of domestic demand with the imposition of this tariff. Label this point 'B'.
(1. HORIZONTAL LINE 5 ABOVE THE ORIGINAL PRICE
2. NEW DOMESTIC DEMAND WHERE TARIFF LINE MEETS DOMESTIC DEMAND LINE)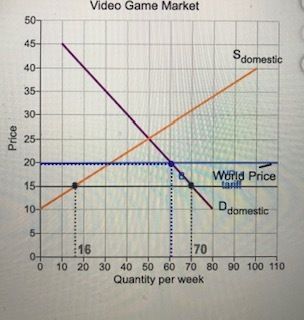
- 54—Suppose the exchange rate between the British pound and the U.S. dollar is £1 = $2.00.
The Bank of England implements a contractionary monetary policy.
Illustrate the impact of this change in the market for pounds.
1.) Using the line drawing tool,
draw and label a new demand line.
2.) Using the line drawing tool,
draw and label a new supply line. (DEMAND SHIFT RIGHT SUPPLY SHIFT LEFT)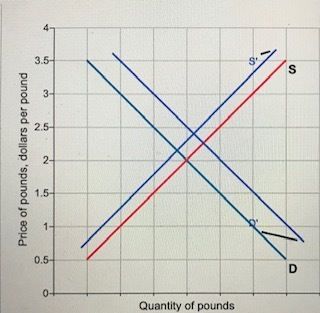
- 55—The following table gives the exchange rates for two dates in 2014.
-The US dollar APPRECIATED against all four currencies during 2014 (depreciating= become worth less, appreciating= becoming worth more)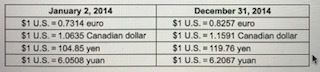
- 56—The following table gives values for U.S. exports, imports, and the trade balance for 2014.
The exchange rates may have had an impact on the changes in U.S exports, imports, and the trade balance because the appreciation of the dollar against the currencies of some of the U.S.'s major trade partners: 1. made US exports more expensive for Canadian and Chinese consumers 2. made imports from these countries more affordable for US consumers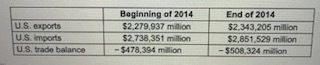
- 57—The currency of Atlantis is the wimp. In 2015, Atlantis developed a balance-of-payments deficit with the United States as a result of an unanticipated decrease in exports; U.S. citizens cut back on the purchase of Atlantean goods. Assume Atlantis is operating under a system of fixed exchange rates.
How does the drop in exports affect the market for wimps?
1.) Using the line drawing tool,
draw a new demand line showing how the unanticipated decrease in exports influences the market for wimps. Properly label your line. (DEMAND SHIFT LEFT)
-The balance-of-payments deficit is the difference between the: new quantity demanded and initial quantity demanded
-To maintain the value of the wimp (in the long run), the government of Atlantis must: use contractionary monetary policy
-If Atlantis had originally been operating at full employment (potential GDP), an unanticipated decrease in exports would have caused: an increase in unemployment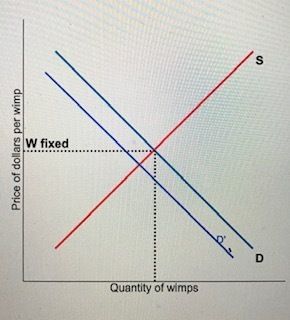
- 58—The chief economist of Atlantis suggests an expansionary monetary policy to restore full employment; the Secretary of Commerce suggests a tax cut (expansionary fiscal policy).
Given the fixed exchange rate system, describe the effects of these two policy options on Atlantis's current account: expansionary monetary policy and expansionary fiscal policy would both make the current account deficit worse
If the two countries operated under a floating rate system, the exchange rate would fall immediately, the quantity of exports would: rise in Atlantis, and the quantity of imports would fall, restoring balance - 59—The graph to the right shows the supply and demand for euros.
Suppose that the inflation rate in the U.S. rises faster than the inflation rate in Europe.
Use the line drawing tool to show the effects on the market. Both lines will shift. Properly label each line. (SUPPLY SHIFT LEFT DEMAND SHIFT RIGHT)
-The higher U.S. inflation rate will cause the dollar to DEPRECIATE relative to the euro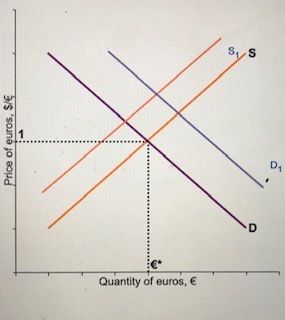
Informações
- Descrição
- FlashCards sobre Econ Final, criado por Alli Yocum em 11-05-2020.
- Criado por
- Alli Yocum
- Visualizações
- 1
- Avaliação