
Flashcards
Data Handling
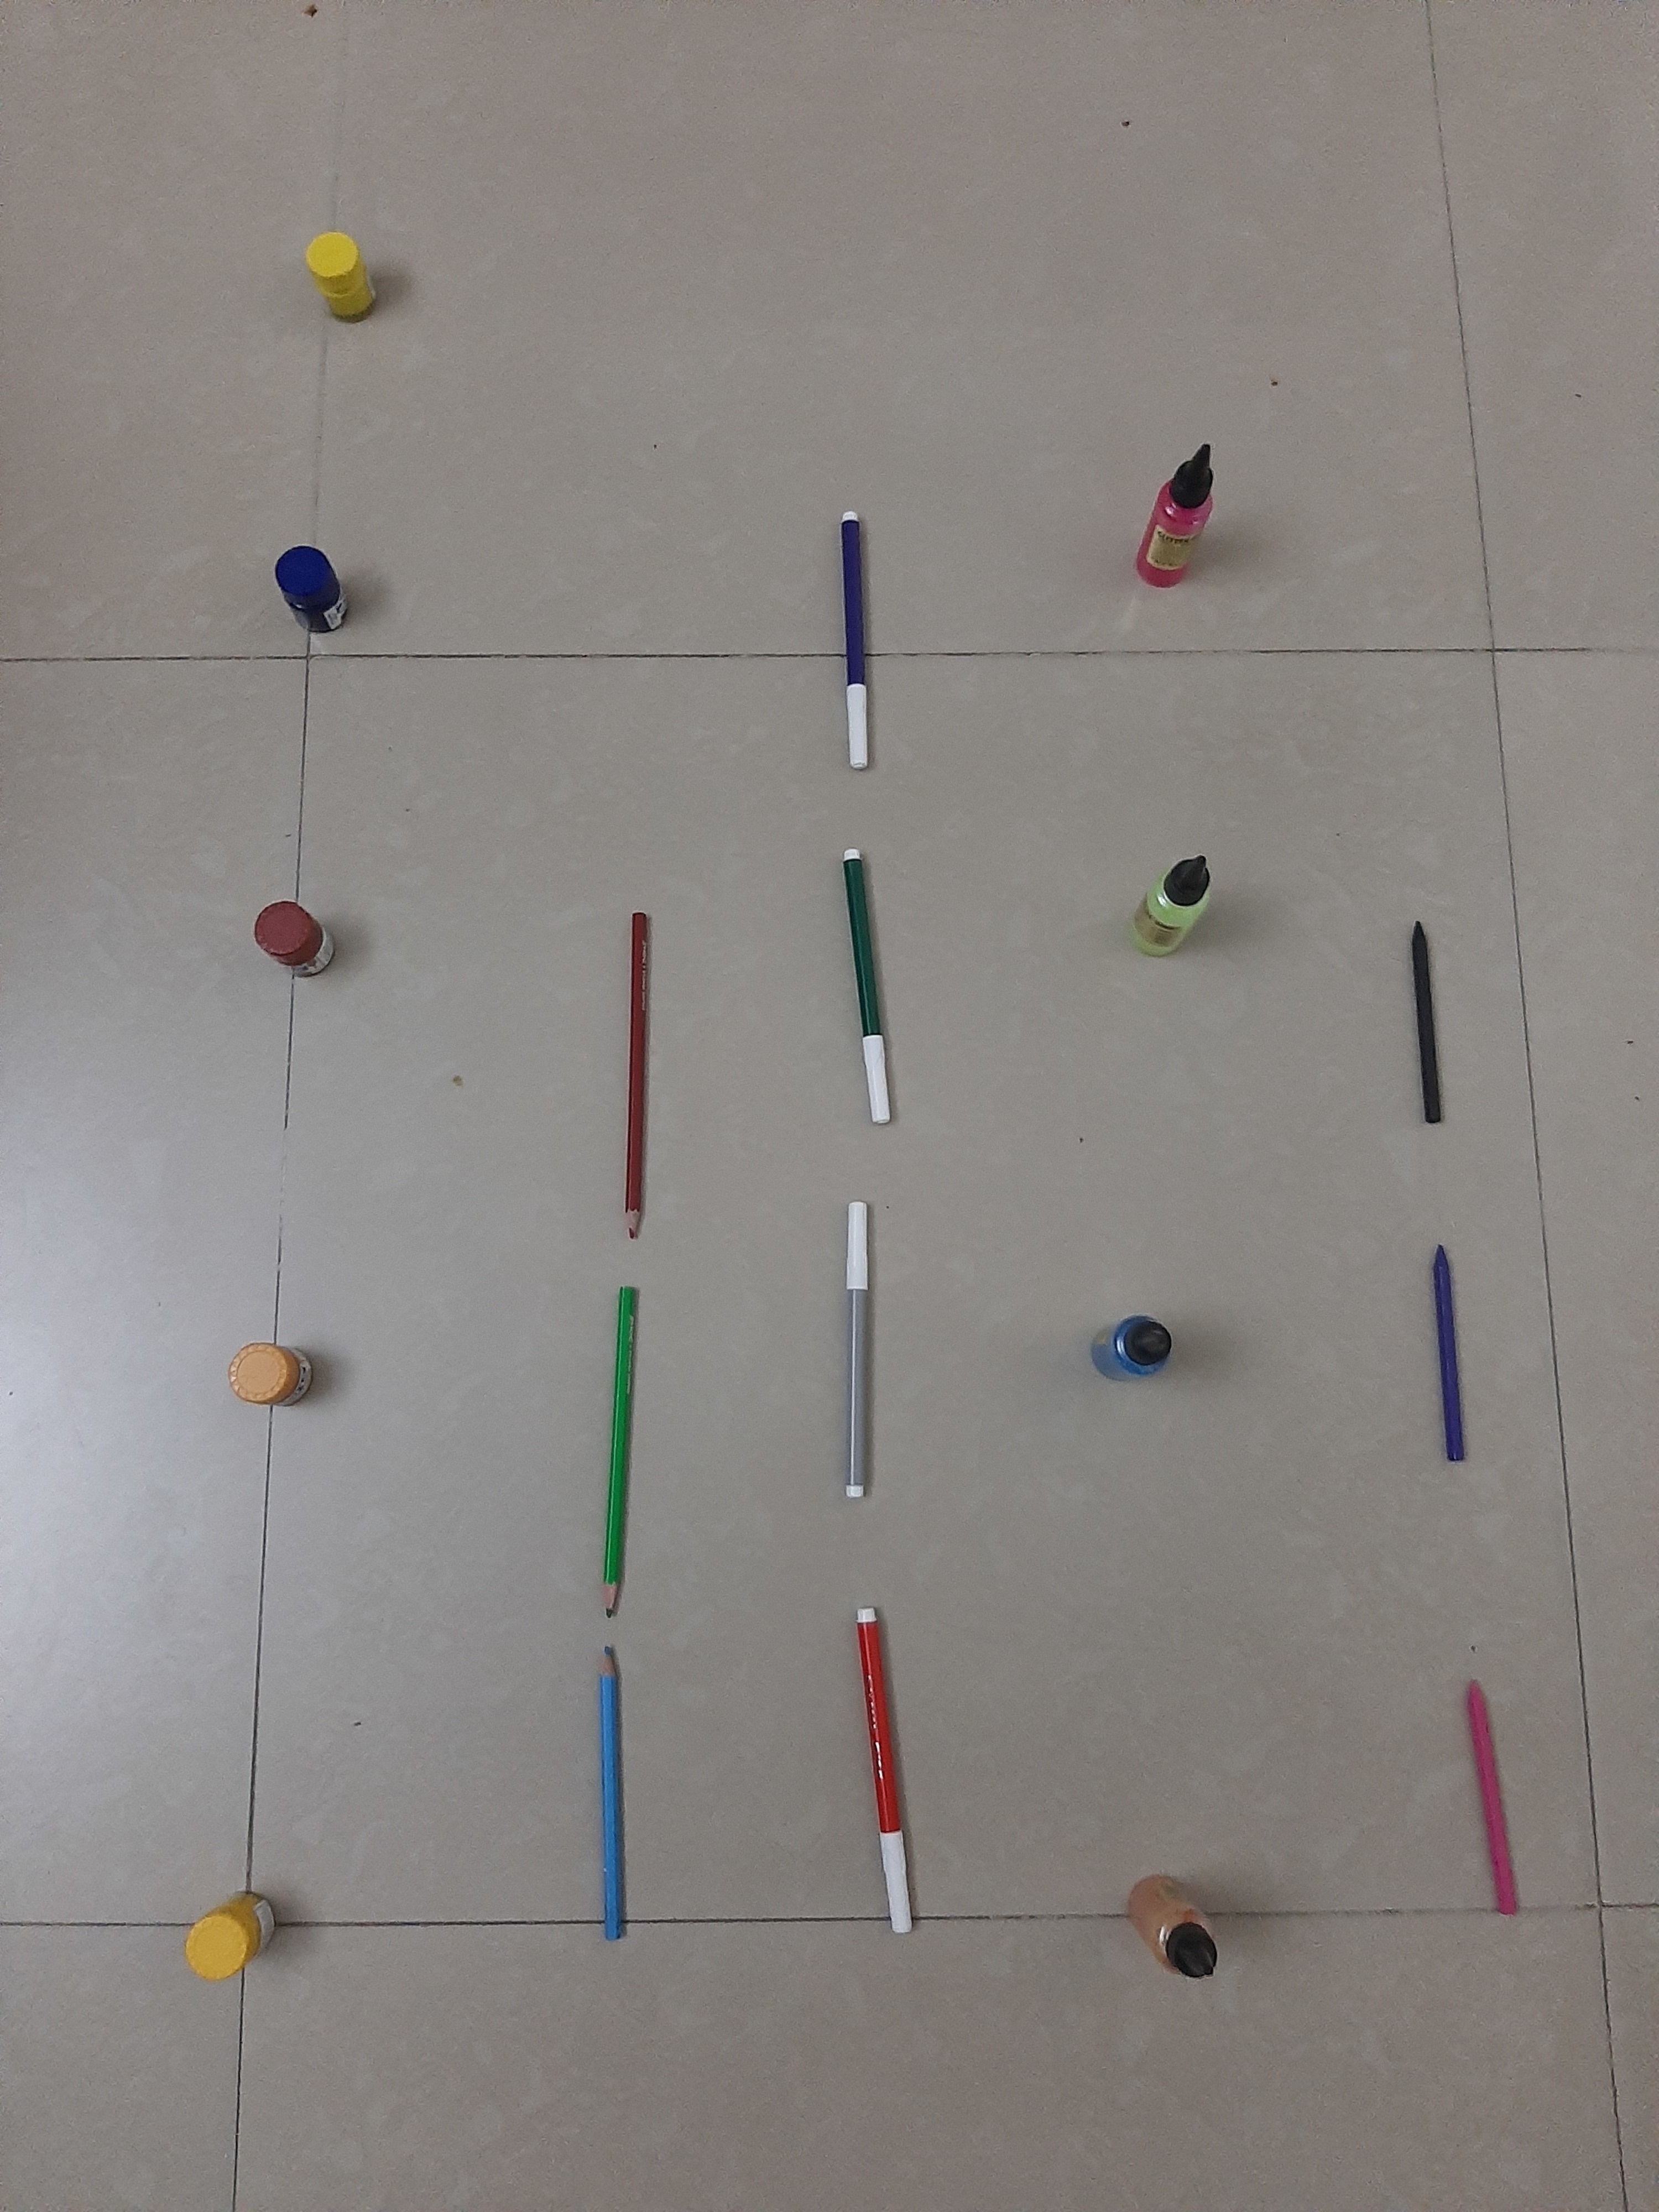
Flashcards do conjunto (3)
- 1—A bar graph is a chart or graph that presents categorical data with rectangular bars with heights or lengths proportional to the values that they represents. The bar can be plotted vertically or horizontally.
- 2The three main parts are title, scale, label. Bar graphs are extremely effective visual to use in presentation and report.Bar graph allows the reader to recognize patterns or trends more easily than looking at the table of numerical data.
- 3In this bar different types of colors and its number. Color with more number shows taller bar and those with less number shows small bar.Y axis is showing number of colors and the X axis is showing the types of colors.
Informações
- Descrição
- v Mathematics FlashCards sobre Data Handling, criado por AKANSH AGARWAL em 16-07-2021.
- Criado por
- AKANSH AGARWAL
- Visualizações
- 57
- Tags
- Histórico
-
- Criado por AKANSH AGARWAL · 16 jul 2021
- Copiado por AKANSH AGARWAL · 16 jul 2021
- Avaliação