Box Plots

Descrição

Mindmap
Tara_
Mapa Mental por Tara_, atualizado more than 1 year ago
Tara_
Criado por Tara_ aproximadamente 9 anos atrás
19
1

Resumo de Recurso

Box Plots
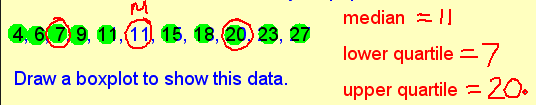
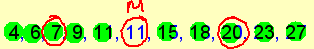
  1. first you need to find the
    1. median
      1. Middle number
      2. Lowe quartile
        1. The middle number to the left of the median
        2. upper quartile
          1. middle number to the right of the median
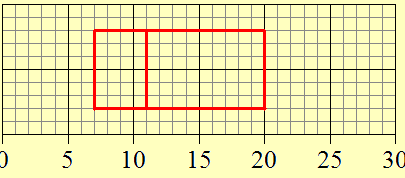
          2. Then you draw the upper quartile, lower quartile and median onto your graph

            Anotações:

            • Join them the lines up to make a box
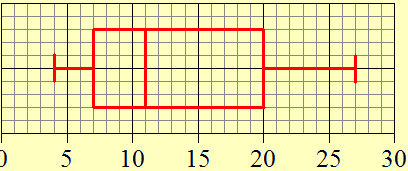
            1. Then you add wiskers
              1. Smallest number on the left
                1. Biggest number on the right
            2. Interquartile range= Lower quartile - Upper quartile

              Semelhante

              New GCSE Maths
              Sarah Egan
              Maths GCSE - What to revise!
              livvy_hurrell
              TYPES OF DATA
              Elliot O'Leary
              GCSE Maths Conversions
              EmilieT
              GROUPED DATA FREQUENCY TABLES: MODAL CLASS AND ESTIMATE OF MEAN
              Elliot O'Leary
              SAMPLING
              Elliot O'Leary
              Mathematics A - Edexcel - GCSE - Paper 1 November 2014 1MA0/1H Theory
              Josh Anderson
              Solving Simultaneous Equations
              Oliver Murphy
              FREQUENCY TABLES: MODE, MEDIAN AND MEAN
              Elliot O'Leary
              CUMULATIVE FREQUENCY DIAGRAMS
              Elliot O'Leary
              STEM AND LEAF DIAGRAMS
              Elliot O'Leary