
Mapa mental
statistical quality control
Conteúdo do mapa
statistical quality control
Types of statistical quality tools
- 1. Design of experiment (DOE)
- -development the key variables influencing the quality characteristics of product or process
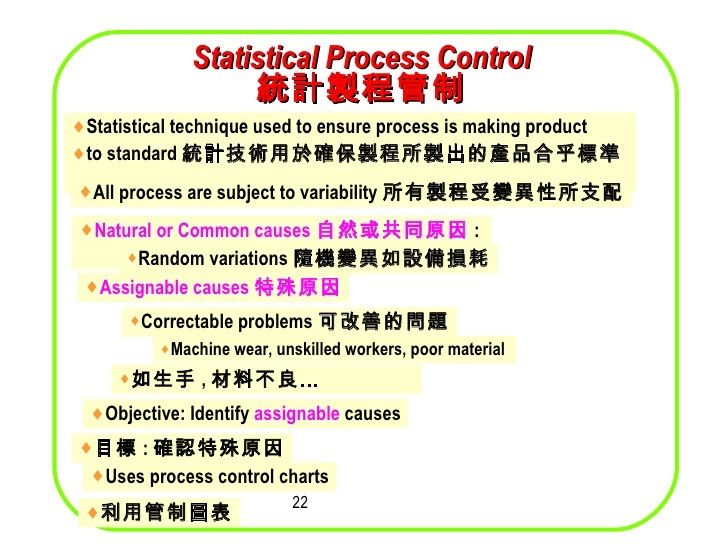
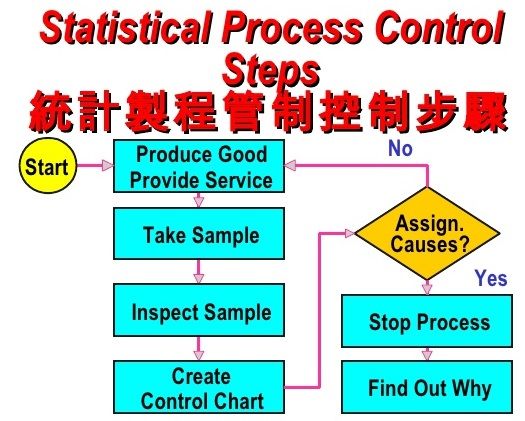
- 2. statistical process control (SPC)
- - product control is a matter of defect detection and containment, and effects outgoing quality levels
- - process control is a matter of defect prevention which affects both outgoing quality &productivity
- - used to predict process performance and to achieve stability
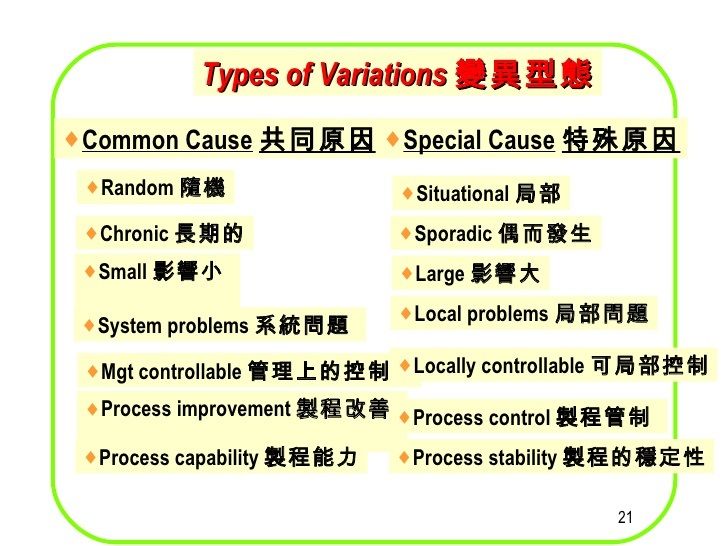
- types of variations
- 1. Chance variation
- - common variation/ natural variation
- - impossible to fully eliminate (85% of quality problem)
- -if only chance variation is present, output of process forms a distribution that is stable over time & is predictable
- in statistical control
- 2. assignment variation
- as special variation , is easy to identify &eliminate (compare to Chance variation)
- - 15% of quality problems
- -if only assignable variation is present, output of process is not stable over time & is nor predictable
- out of statistical control
- - 15% of quality problems
- as special variation , is easy to identify &eliminate (compare to Chance variation)
- 1. Chance variation
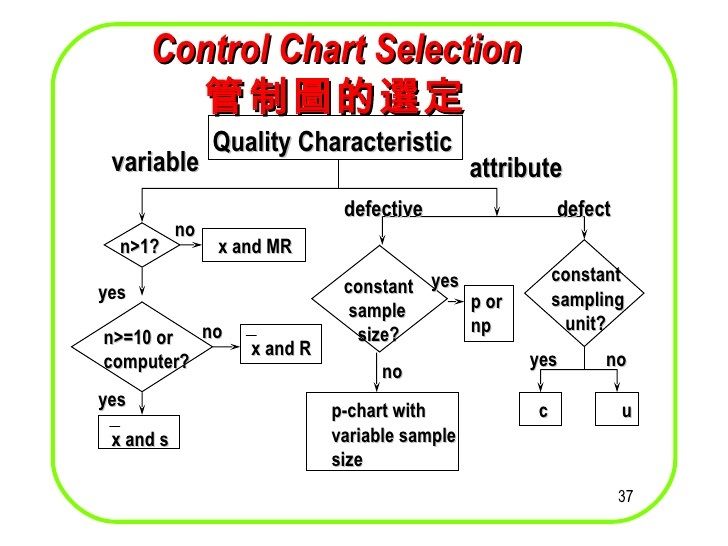
- Types of control charts
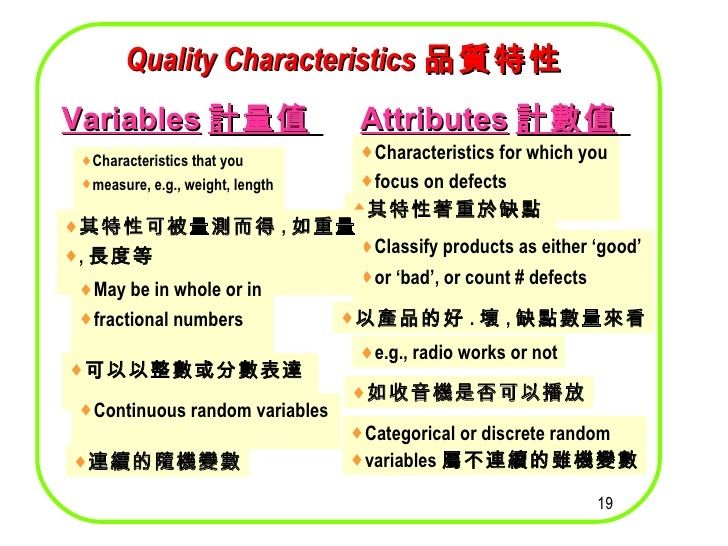
- 1. variables
- 2. attributes
- Principles of control charts
- - control charts are designed to detect deviation of process from a pre-determined normal status and flag early warning
- - a process is considered normal if it is under statistical control, i.e. exhibits only chance variation
- location and disersion
- - a process is considered normal if it is under statistical control, i.e. exhibits only chance variation
- - control charts are designed to detect deviation of process from a pre-determined normal status and flag early warning
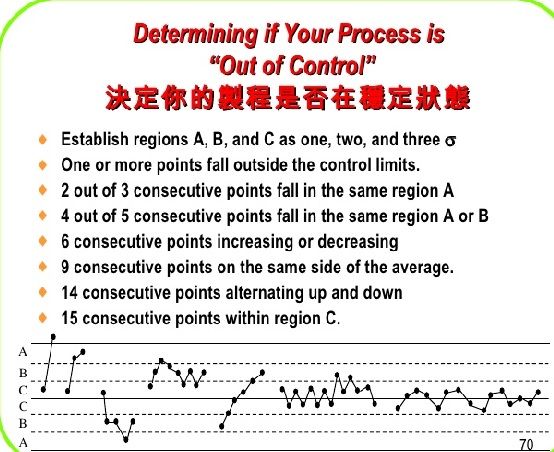
- interpretation of control charts ( 8 rules)
- Limitations of variable control chart
- monitor only one quality characteristic per set of charts &several charts will be needed if > one
- didn't tell us whether process is meeting specification tolerance (acceptable range as stated by customers), only indicate whether it is under statistical control
- don't identify assignable causes & don't tell us how to eliminate effects of these causes
- serve as statistically-based warning devices for process problems
- don't identify assignable causes & don't tell us how to eliminate effects of these causes
- didn't tell us whether process is meeting specification tolerance (acceptable range as stated by customers), only indicate whether it is under statistical control
- monitor only one quality characteristic per set of charts &several charts will be needed if > one
- 4. acceptance sampling
- 1. Design of experiment (DOE)
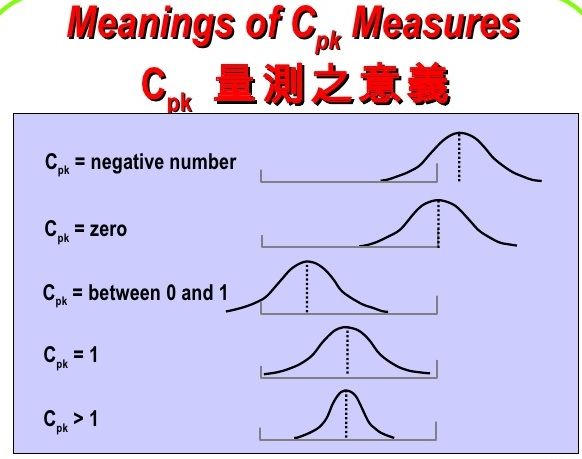
3. process capability study
- - reflect the ability of a process to satisfy tolerance specification
Imagens e arquivos do mapa
Informações
- Descrição
- Mapa Mental sobre statistical quality control, criado por CFL em 18-11-2014.
- Criado por
- CFL
- Visualizações
- 12
- Avaliação