
Mapa mental
Break Even Analysis
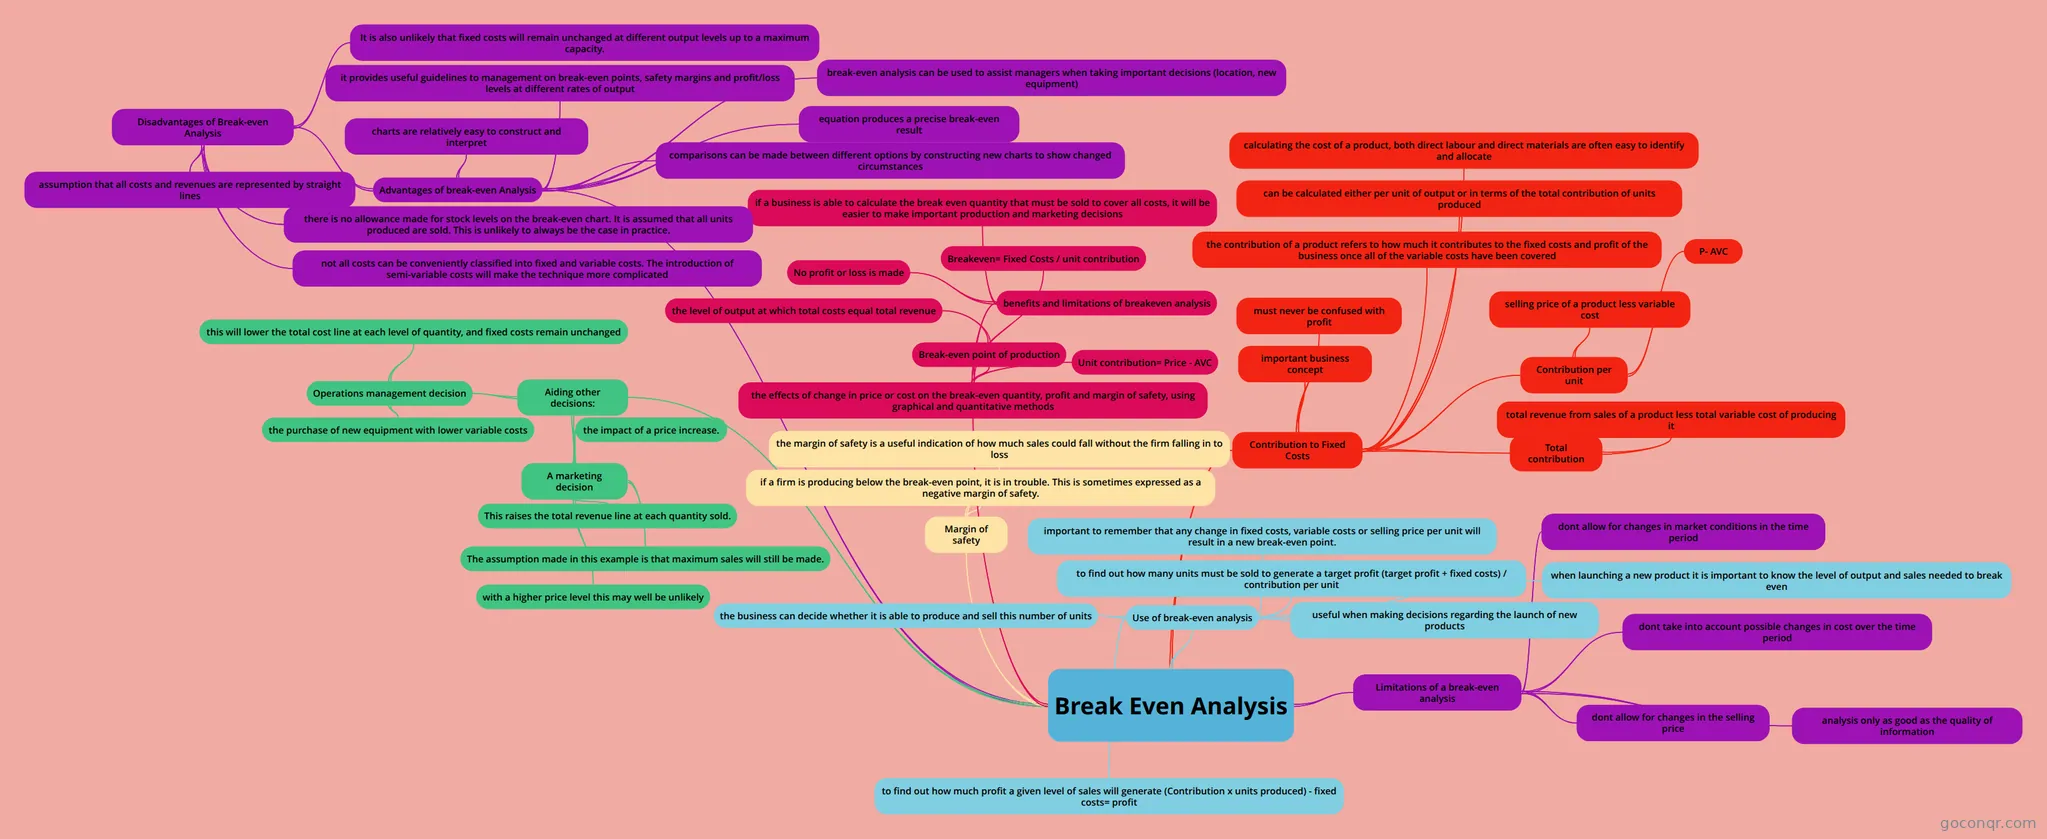
Mind map: Break even analysis
Conteúdo do mapa
Break Even Analysis
Use of break-even analysis
- to find out how much profit a given level of sales will generate (Contribution x units produced) - fixed costs= profit
- to find out how many units must be sold to generate a target profit (target profit + fixed costs) / contribution per unit
- important to remember that any change in fixed costs, variable costs or selling price per unit will result in a new break-even point.
- the business can decide whether it is able to produce and sell this number of units
- useful when making decisions regarding the launch of new products
- when launching a new product it is important to know the level of output and sales needed to break even
Limitations of a break-even analysis
- dont take into account possible changes in cost over the time period
- dont allow for changes in the selling price
- analysis only as good as the quality of information
- dont allow for changes in market conditions in the time period
Contribution to Fixed Costs
- important business concept
- must never be confused with profit
- the contribution of a product refers to how much it contributes to the fixed costs and profit of the business once all of the variable costs have been covered
- can be calculated either per unit of output or in terms of the total contribution of units produced
- calculating the cost of a product, both direct labour and direct materials are often easy to identify and allocate
- Contribution per unit
- selling price of a product less variable cost
- P- AVC
- Total contribution
- total revenue from sales of a product less total variable cost of producing it
the effects of change in price or cost on the break-even quantity, profit and margin of safety, using graphical and quantitative methods
- benefits and limitations of breakeven analysis
- if a business is able to calculate the break even quantity that must be sold to cover all costs, it will be easier to make important production and marketing decisions
- No profit or loss is made
- Break-even point of production
- the level of output at which total costs equal total revenue
- Breakeven= Fixed Costs / unit contribution
- Unit contribution= Price - AVC
- benefits and limitations of breakeven analysis
Margin of safety
- the margin of safety is a useful indication of how much sales could fall without the firm falling in to loss
- if a firm is producing below the break-even point, it is in trouble. This is sometimes expressed as a negative margin of safety.
Aiding other decisions:
- A marketing decision
- the impact of a price increase.
- This raises the total revenue line at each quantity sold.
- The assumption made in this example is that maximum sales will still be made.
- with a higher price level this may well be unlikely
- Operations management decision
- the purchase of new equipment with lower variable costs
- this will lower the total cost line at each level of quantity, and fixed costs remain unchanged
- A marketing decision
Advantages of break-even Analysis
- charts are relatively easy to construct and interpret
- it provides useful guidelines to management on break-even points, safety margins and profit/loss levels at different rates of output
- comparisons can be made between different options by constructing new charts to show changed circumstances
- equation produces a precise break-even result
- break-even analysis can be used to assist managers when taking important decisions (location, new equipment)
- Disadvantages of Break-even Analysis
- assumption that all costs and revenues are represented by straight lines
- not all costs can be conveniently classified into fixed and variable costs. The introduction of semi-variable costs will make the technique more complicated
- there is no allowance made for stock levels on the break-even chart. It is assumed that all units produced are sold. This is unlikely to always be the case in practice.
- It is also unlikely that fixed costs will remain unchanged at different output levels up to a maximum capacity.
Informações
- Descrição
- IB Business Management HL (Unit 3- finance and accounts) Mapa Mental sobre Break Even Analysis, criado por Nathalia Maria Veit em 27-02-2016.
- Criado por
- Nathalia Maria Veit
- Visualizações
- 3
- Avaliação