
Mapa mental
Demand
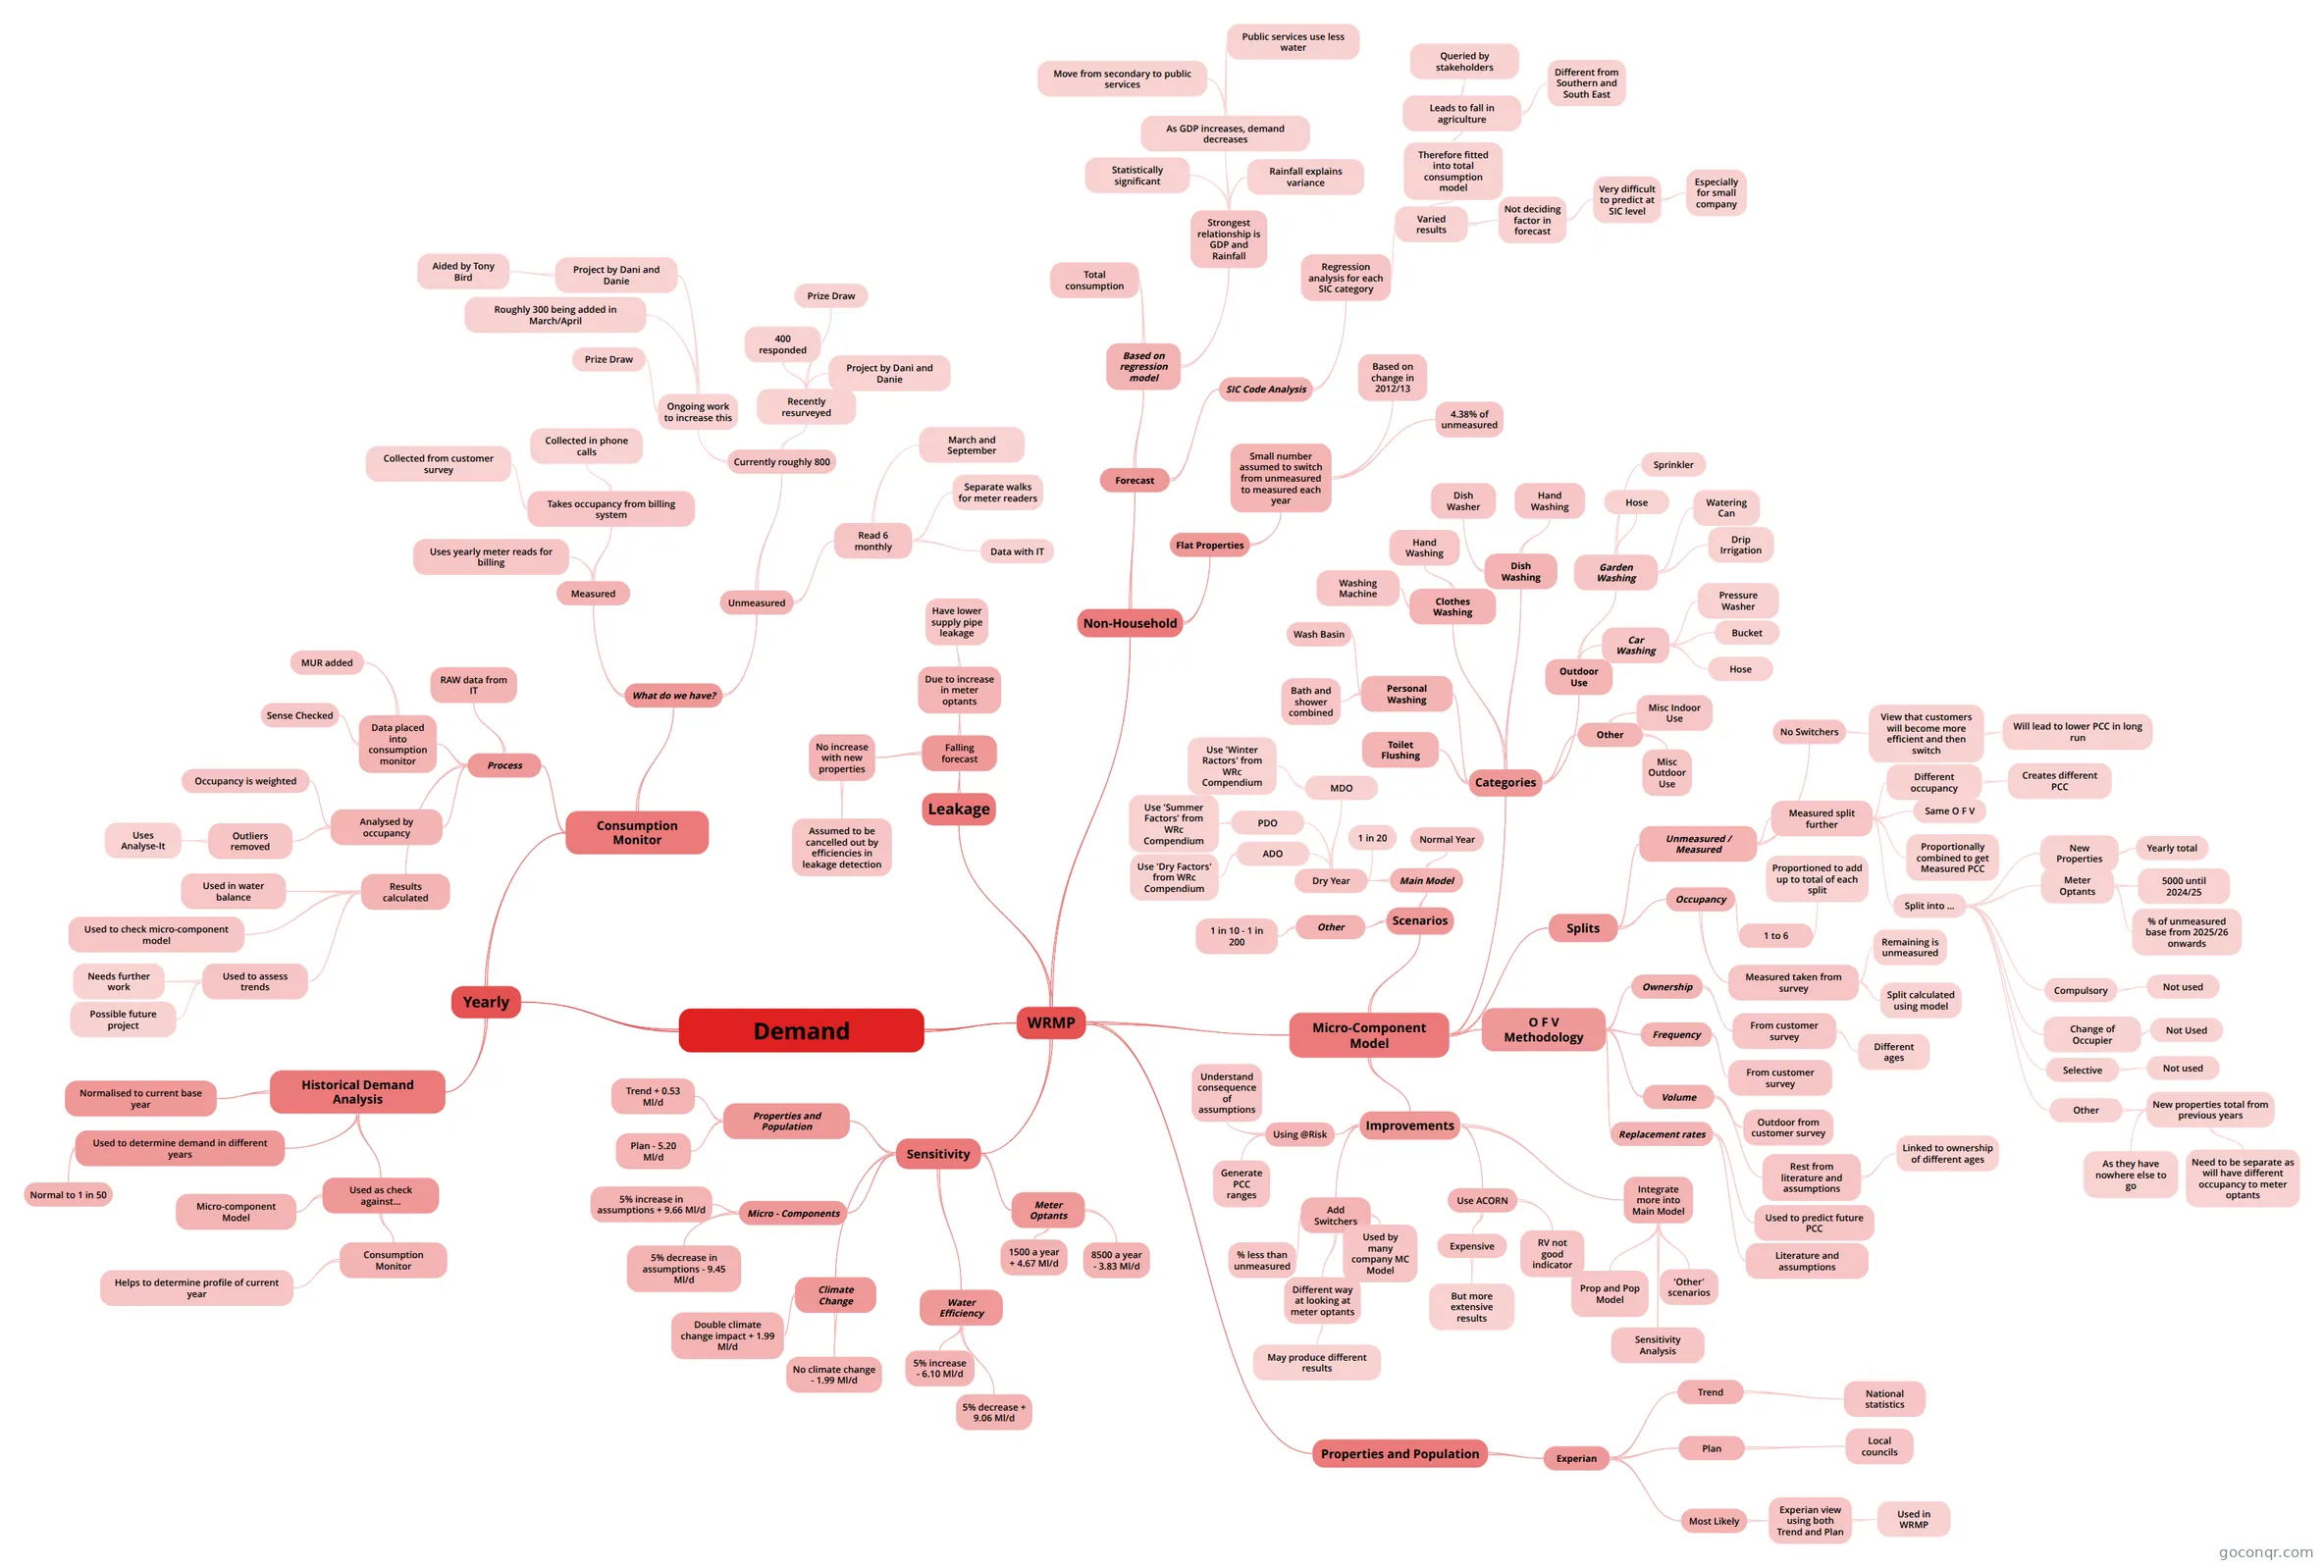
Mind map: Demand water resource management plan
Conteúdo do mapa
Demand
WRMP
- Micro-Component Model
- Splits
- Unmeasured / Measured
- No Switchers
- View that customers will become more efficient and then switch
- Will lead to lower PCC in long run
- View that customers will become more efficient and then switch
- Measured split further
- Different occupancy
- Creates different PCC
- Same O F V
- Proportionally combined to get Measured PCC
- Split into ...
- New Properties
- Yearly total
- Meter Optants
- 5000 until 2024/25
- % of unmeasured base from 2025/26 onwards
- Compulsory
- Not used
- Change of Occupier
- Not Used
- Selective
- Not used
- Other
- New properties total from previous years
- As they have nowhere else to go
- Need to be separate as will have different occupancy to meter optants
- New properties total from previous years
- New Properties
- Different occupancy
- No Switchers
- Occupancy
- 1 to 6
- Proportioned to add up to total of each split
- Measured taken from survey
- Remaining is unmeasured
- Split calculated using model
- 1 to 6
- Unmeasured / Measured
- O F V Methodology
- Ownership
- From customer survey
- Different ages
- From customer survey
- Frequency
- From customer survey
- Volume
- Outdoor from customer survey
- Rest from literature and assumptions
- Linked to ownership of different ages
- Replacement rates
- Literature and assumptions
- Used to predict future PCC
- Ownership
- Categories
- Toilet Flushing
- Personal Washing
- Bath and shower combined
- Wash Basin
- Clothes Washing
- Washing Machine
- Hand Washing
- Dish Washing
- Dish Washer
- Hand Washing
- Outdoor Use
- Garden Washing
- Hose
- Sprinkler
- Watering Can
- Drip Irrigation
- Car Washing
- Bucket
- Hose
- Pressure Washer
- Garden Washing
- Other
- Misc Indoor Use
- Misc Outdoor Use
- Scenarios
- Main Model
- Normal Year
- Dry Year
- ADO
- Use 'Dry Factors' from WRc Compendium
- PDO
- Use 'Summer Factors' from WRc Compendium
- MDO
- Use 'Winter Ractors' from WRc Compendium
- 1 in 20
- ADO
- Other
- 1 in 10 - 1 in 200
- Main Model
- Improvements
- Using @Risk
- Understand consequence of assumptions
- Generate PCC ranges
- Add Switchers
- % less than unmeasured
- Used by many company MC Model
- Different way at looking at meter optants
- May produce different results
- Use ACORN
- Expensive
- But more extensive results
- RV not good indicator
- Expensive
- Integrate more into Main Model
- Prop and Pop Model
- 'Other' scenarios
- Sensitivity Analysis
- Using @Risk
- Splits
- Non-Household
- Flat Properties
- Small number assumed to switch from unmeasured to measured each year
- 4.38% of unmeasured
- Based on change in 2012/13
- Small number assumed to switch from unmeasured to measured each year
- Forecast
- Based on regression model
- Total consumption
- Strongest relationship is GDP and Rainfall
- Statistically significant
- As GDP increases, demand decreases
- Move from secondary to public services
- Public services use less water
- Rainfall explains variance
- SIC Code Analysis
- Regression analysis for each SIC category
- Varied results
- Therefore fitted into total consumption model
- Leads to fall in agriculture
- Queried by stakeholders
- Different from Southern and South East
- Leads to fall in agriculture
- Not deciding factor in forecast
- Very difficult to predict at SIC level
- Especially for small company
- Very difficult to predict at SIC level
- Therefore fitted into total consumption model
- Varied results
- Regression analysis for each SIC category
- Based on regression model
- Flat Properties
- Properties and Population
- Experian
- Trend
- National statistics
- Plan
- Local councils
- Most Likely
- Experian view using both Trend and Plan
- Used in WRMP
- Experian view using both Trend and Plan
- Trend
- Experian
- Leakage
- Falling forecast
- No increase with new properties
- Assumed to be cancelled out by efficiencies in leakage detection
- Due to increase in meter optants
- Have lower supply pipe leakage
- No increase with new properties
- Falling forecast
- Sensitivity
- Properties and Population
- Trend + 0.53 Ml/d
- Plan - 5.20 Ml/d
- Climate Change
- Double climate change impact + 1.99 Ml/d
- No climate change - 1.99 Ml/d
- Water Efficiency
- 5% increase - 6.10 Ml/d
- 5% decrease + 9.06 Ml/d
- Meter Optants
- 1500 a year + 4.67 Ml/d
- 8500 a year - 3.83 Ml/d
- Micro - Components
- 5% increase in assumptions + 9.66 Ml/d
- 5% decrease in assumptions - 9.45 Ml/d
- Properties and Population
- Micro-Component Model
Yearly
- Consumption Monitor
- What do we have?
- Unmeasured
- Read 6 monthly
- March and September
- Separate walks for meter readers
- Data with IT
- Currently roughly 800
- Ongoing work to increase this
- Prize Draw
- Roughly 300 being added in March/April
- Project by Dani and Danie
- Aided by Tony Bird
- Recently resurveyed
- 400 responded
- Prize Draw
- Project by Dani and Danie
- Ongoing work to increase this
- Read 6 monthly
- Measured
- Uses yearly meter reads for billing
- Takes occupancy from billing system
- Collected from customer survey
- Collected in phone calls
- Unmeasured
- Process
- RAW data from IT
- Data placed into consumption monitor
- MUR added
- Sense Checked
- Analysed by occupancy
- Outliers removed
- Uses Analyse-It
- Occupancy is weighted
- Outliers removed
- Results calculated
- Used in water balance
- Used to check micro-component model
- Used to assess trends
- Needs further work
- Possible future project
- What do we have?
- Historical Demand Analysis
- Normalised to current base year
- Used to determine demand in different years
- Normal to 1 in 50
- Used as check against...
- Micro-component Model
- Consumption Monitor
- Helps to determine profile of current year
- Consumption Monitor
Informações
- Descrição
- Summary of Demand Workload in Regulation Dept
- Criado por
- j.jones9013
- Visualizações
- 30
- Avaliação