
Notas
Edx- Course
Conteúdo das notas (4)
Página 1
intro-
1) identify the sequence pattern.
2) make prediction about the next based on previous
computers are good at doing calculations. So our job is to define a way for computer to do calculation in correct way.
We are provided with a data-set called cases/observations.
These cases have some numerical feature associated with it that quantify the characteristic we want to work on.
Let say i have a set numerical data X and i am trying to identify Y. So in a way i am trying to define a function on X which predicts Y
Y=f(X)
There are two types of ML.
i) Supervised - We start with the known values for the variable we want to predict = labels.
let say i have labels
{
[ a-1, b-1, c-1 ] : Y-1 (label 1)
[ a-2, b-2, c-2 ] : Y-2 (label 2)
}
i will train the machine with label 1. get a function FUNC.
then verify FUNC with label 2. If verified, then work with new observations for which Y is not known.
ii) Unsupervised - We do not have labels. We find similarities between provided data set to come up to FUNC. After that we add any new observation to the cluster of similar observations.
Página 2
Stats Concept
Correlation coefficient (R) in stats == slope in mathematics ( like -ve slope is negative correlation ). The value of this coefficient lie between -1 & 1. This also denotes the proportionality between two units/variables. positive means increase in one will increase other. negative means increase in one will decrease the other. zero means the change in one will not affect the other. Know how to calculate this R in MS excel.
CoD = (R square) = coffiecient of determination.
This time a value closer to 1 indicates a good fit for the model.
The coefficient of determination is the square of the correlation (r) between predicted y scores and actual y scores; thus, it ranges from 0 to 1.
An R square between 0 and 1 indicates the extent to which the dependent variable is predictable. An R2 of 0.10 means that 10 percent of the variance in Y is predictable from X; an R2 of 0.20 means that 20 percent is predictable; and so on.
1) Root mean square ->
square root of (mean of square of individual entries). First image formula
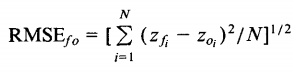
2) Root mean square error / deviation ->
second image formula

Página 3
Supervised ML (Regression techinique)
we create a model from some part of the available labels (data-set).
suppose I got a function FUNC.
So i'll apply the observation/cases from labels to FUNC and get the graph of expected values (regression line). Then i plot the actual values from same labels.
After that we might get some points on graph which don't lie on the FUNC curve(regression line). This denotes the difference between expected and actual value called residual which tell about the error inside our modal.
At this point two error measuring concepts from statistics comes handy: https://medium.com/human-in-a-machine-world/mae-and-rmse-which-metric-is-better-e60ac3bde13d
1) RMSE - value will always be greater than MAE as we square the error before doing average. The RMSE should be more useful when large errors are particularly undesirable.
2) MAE - MAE measures the average magnitude of the errors in a set of predictions, without considering their direction.
They are negatively oriented terms. ( means the lower the value the better it is )
---------------------------------------------------------------------------------------------------------------------------------------------------------
Now if the whole model was derived for a single metric/characteristic then RMSE & MAE is OK
but if we would have to derive a model for multiple metrics then RAE(relative absolute error) & RSE(relative squared error) comes into picture. Their value lies between 0 to 1. The more near their value to 0 the better it is.
Página 4
Supervised ML (classification technique)
It is basically classifying an entity to set of areas present. A binary classification, classify the entity to either 0 or 1.
So our modal function will take a set of values (observation) to generate a value in between 0 & 1.
but as we have to classify the outcome as 0 or 1, we will take a threshold value, & will compare the generated ones with this.
When a generated value is classified as 1 with its actual value 1 -> True positive
When a generated value is classified as 0 when its actual value 0 -> True negative
When a generated value is classified as 1 when its actual value 0 -> False Postive
When a generated value is classified as 0 when its actual value 1 -> False negative
In any case FP and FN denotes the error in modal function.
For example : a model used to finding if a patient is diabetic or not, tell a patient is when actually he is not OR tell a patient isn't when he is -> are the worse case
At the end it is the threshold which identify all four & can control cases in each type.
we use a confusion matrix ->
V expected/H actual 1 0
1 TP FP
0 FN TN
Some stats metrics :-
Accuracy- (TP + TN)/(TP + TN + FP + FN) [ NOT MUCH USEFUL ]
Precision - TP/ (TP + TN)
Recall or True positive rates - TP/(TP + FN )
False Positive rates - FP/(FP + TN )
Informações
- Descrição
- Notas sobre Edx- Course, criado por Lakshaya Sood em 11-04-2018.
- Criado por
- Lakshaya Sood
- Visualizações
- 13
- Avaliação