
Notas
Principal Component Analysis
Conteúdo das notas (10)
Página 1
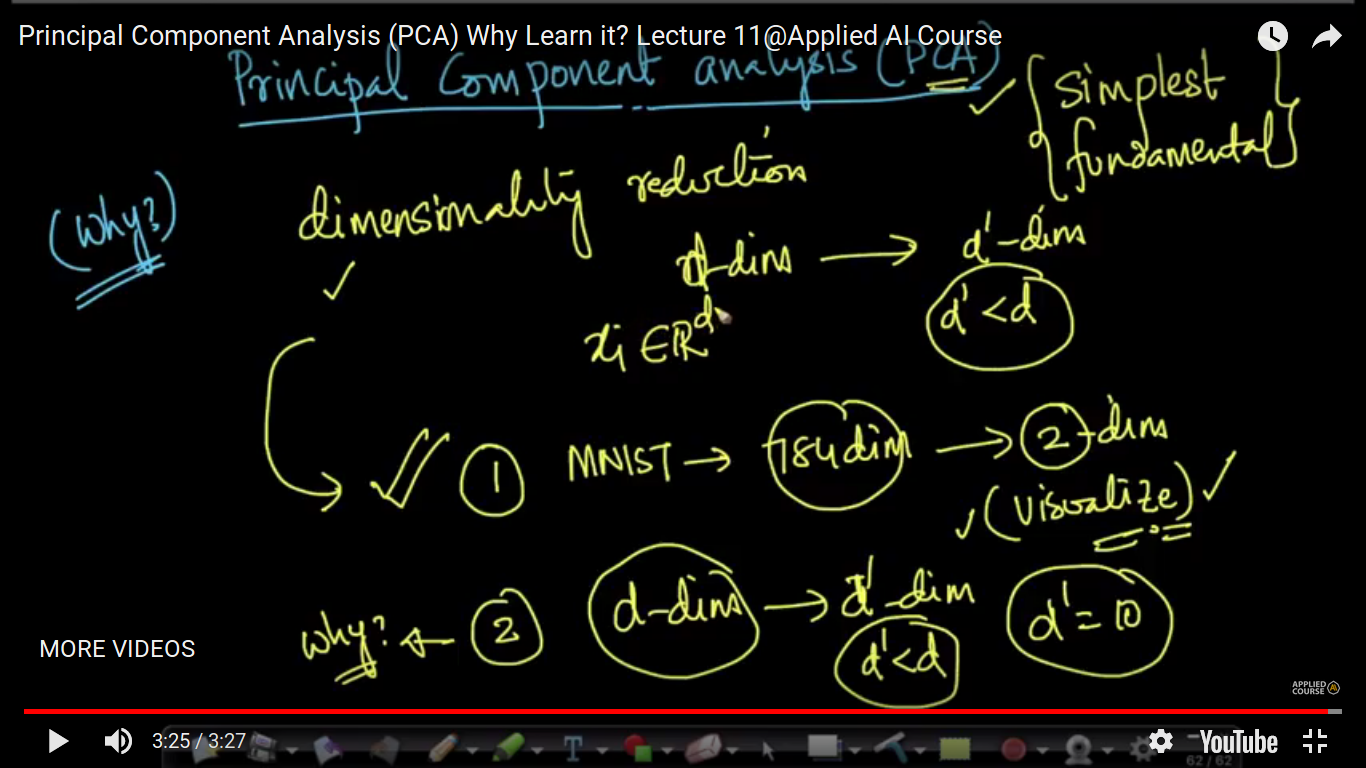
Why learn PCA?
The advantage of using PCA is:
If you want to visualize the high dimensional data, then our pair plot, scatter plot all of them will not work. So, we always convert the data into 2 or 3 dimensions and then visualize it by using PCA.
So, basically, PCA is the simplest fundamental technique which is extensively used in Machine Learning. It is often used for dimensionality reduction and inturn used for visualization of data.
Dimensionality reduction means that converting d-dimen to d' dimen such that d'<d.
Página 2
Geometric intuition of PCA
f1, f2 are the features.
Here, variability or spread or variance is very low. So, to convert into 1-D, we just discard one variable and let it be f1 in our case and keep f2.
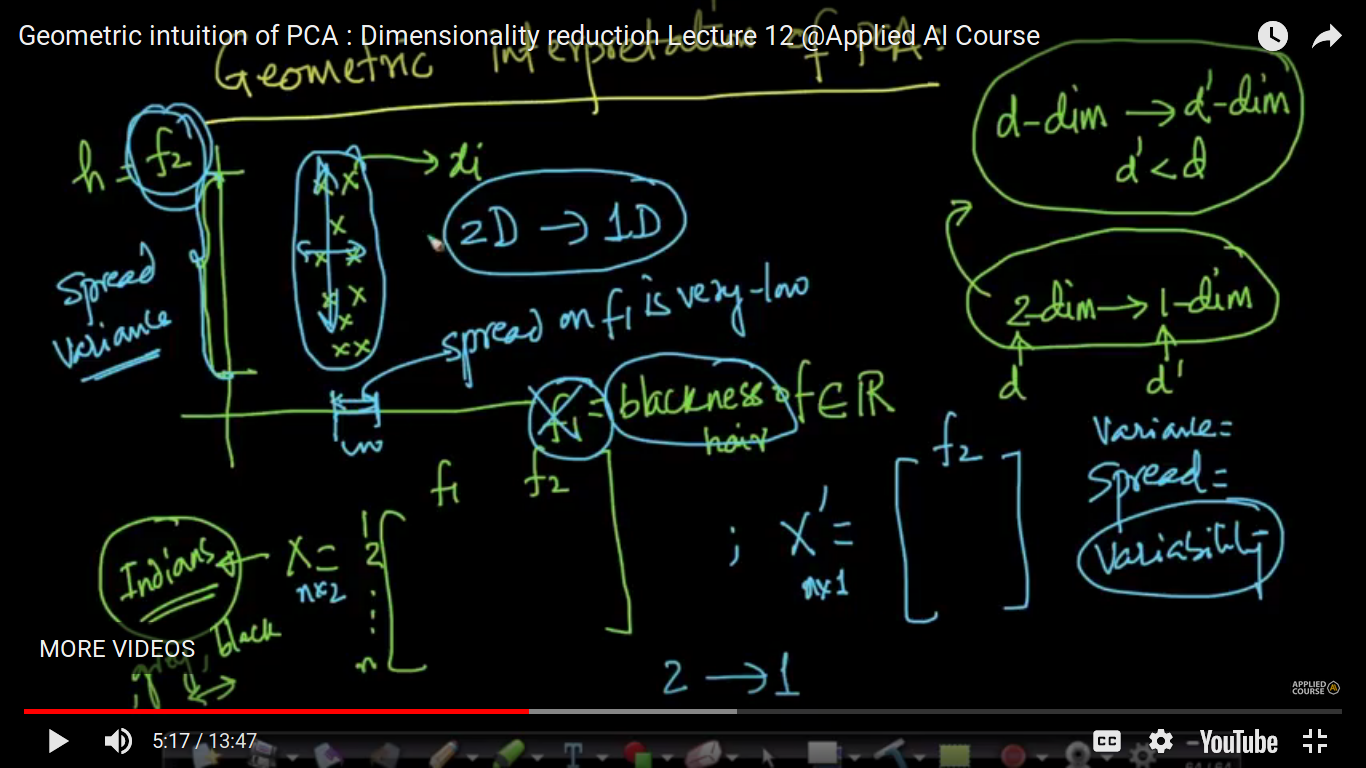
If we have more spread, it means more information to be useful because the spread is a measure of information.
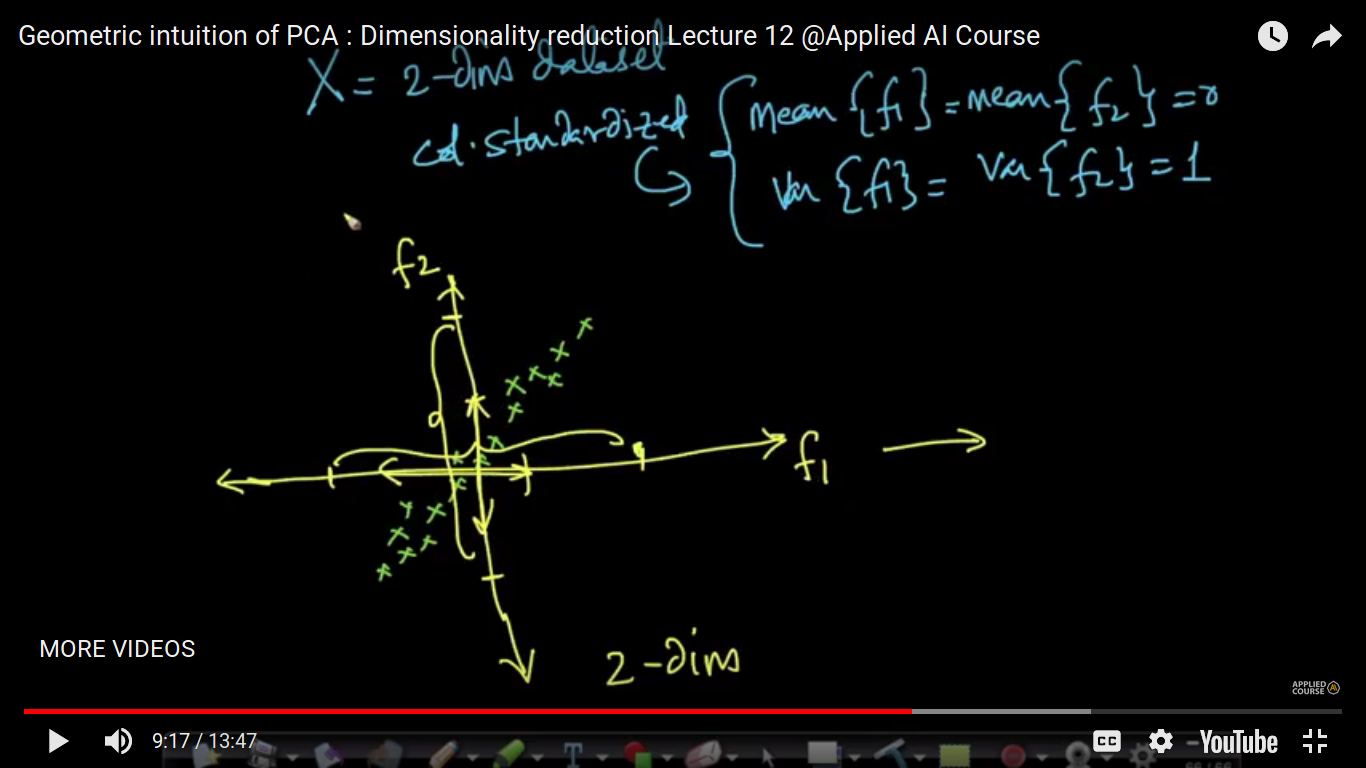
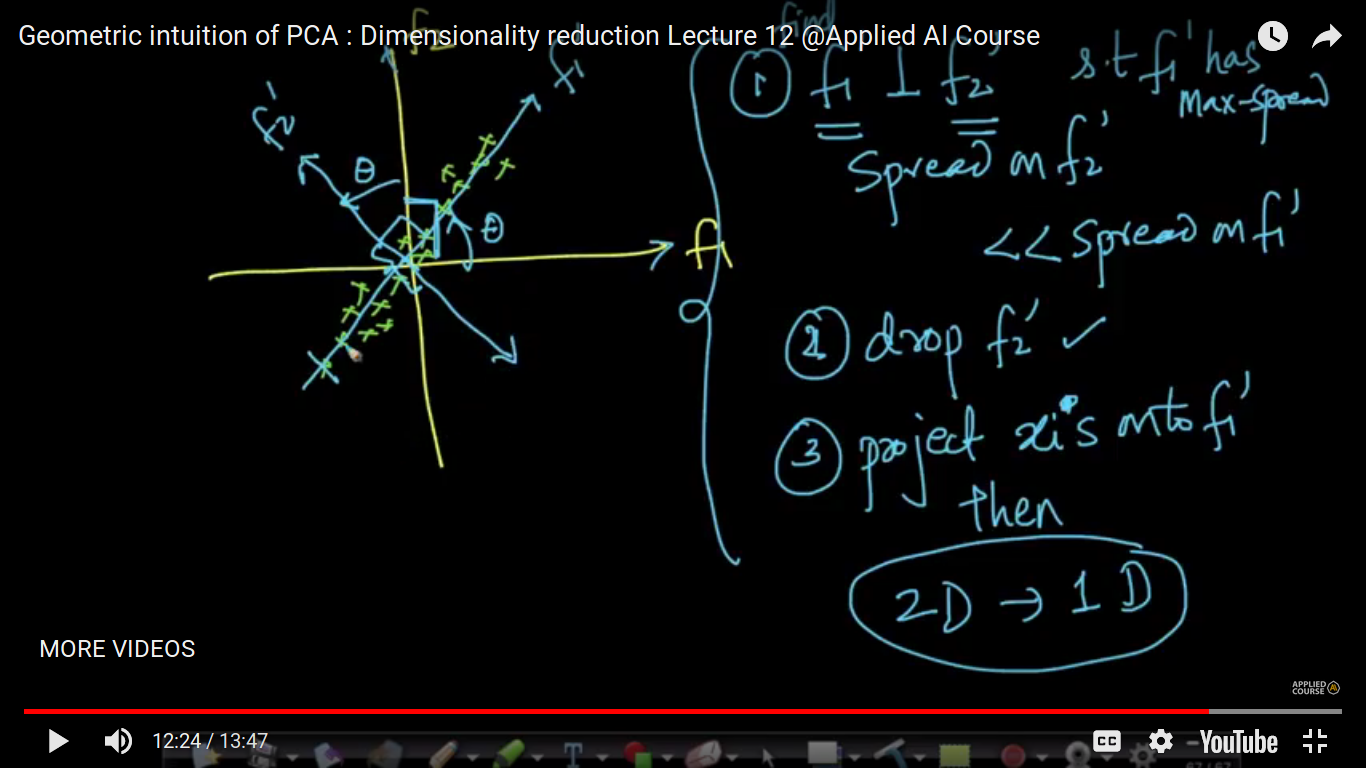
Now, let's take a slightly difficult example.
In this, the spread is significantly large in both case and hence we can't drop any feature either f1 or f2.
s.t. - such that
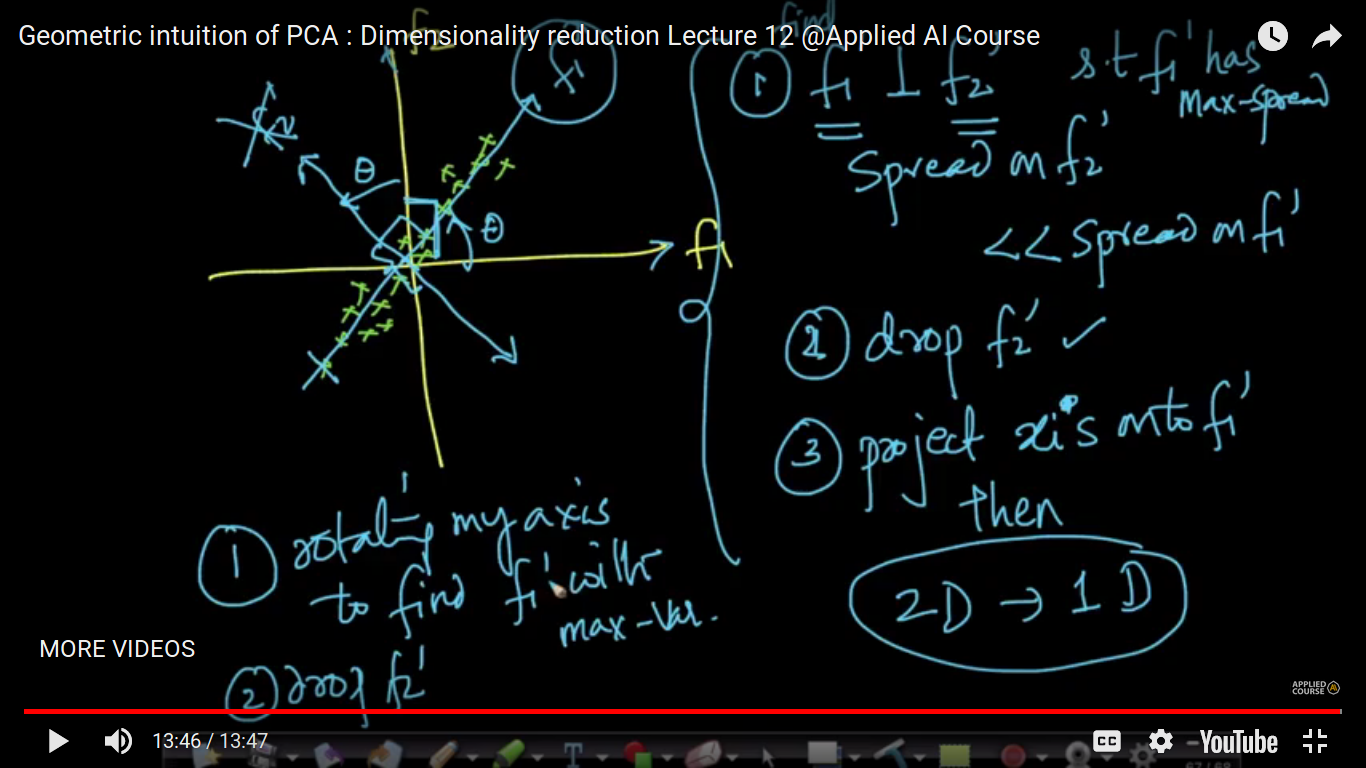
By doing rotation, the relative location of the components doesn’t change, it only changes the actual coordinates of the points.”?
Answer:
In PCA, we are not changing the points present in the space. We are changing the axes, the coordinates of each point will change but the location of each point is not changing.
Why do we preserving the direction of vector here? How significant is the direction? Can you please elaborate?
Answer:
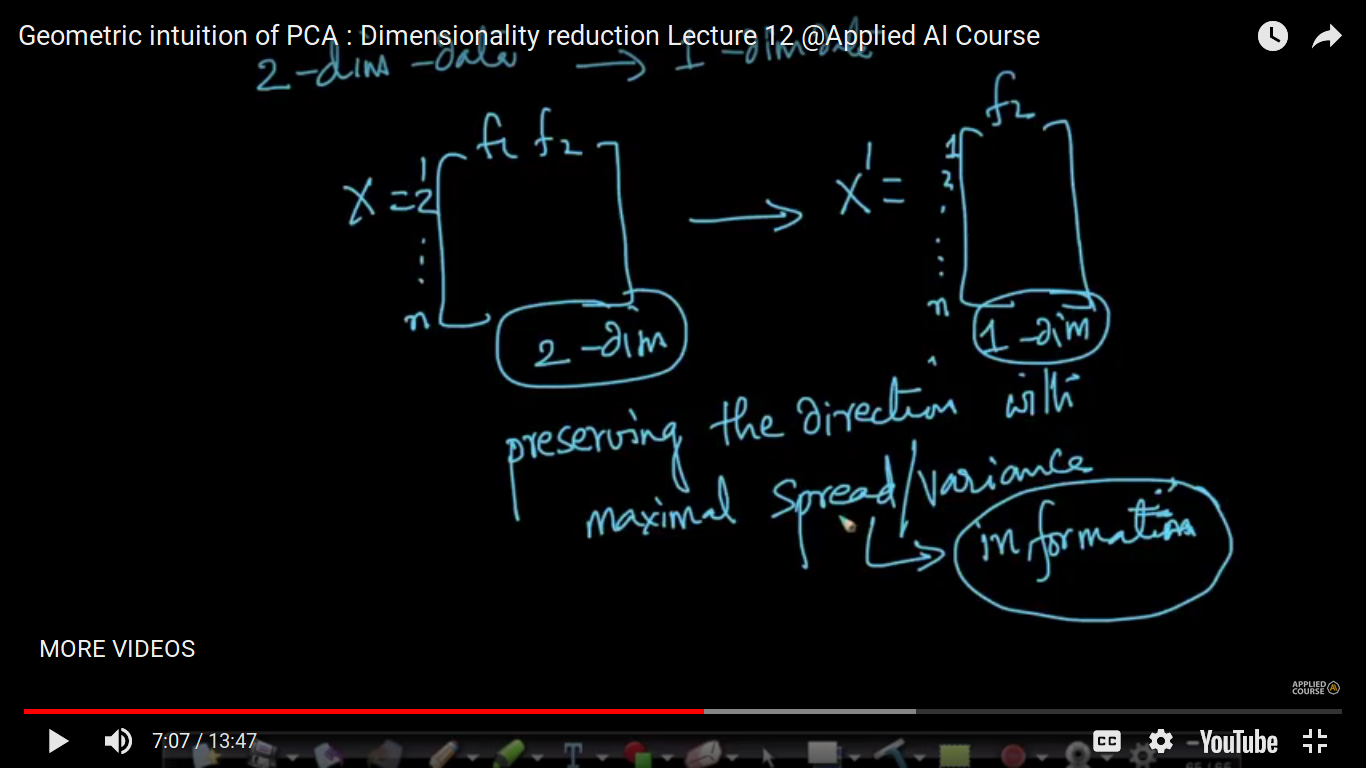
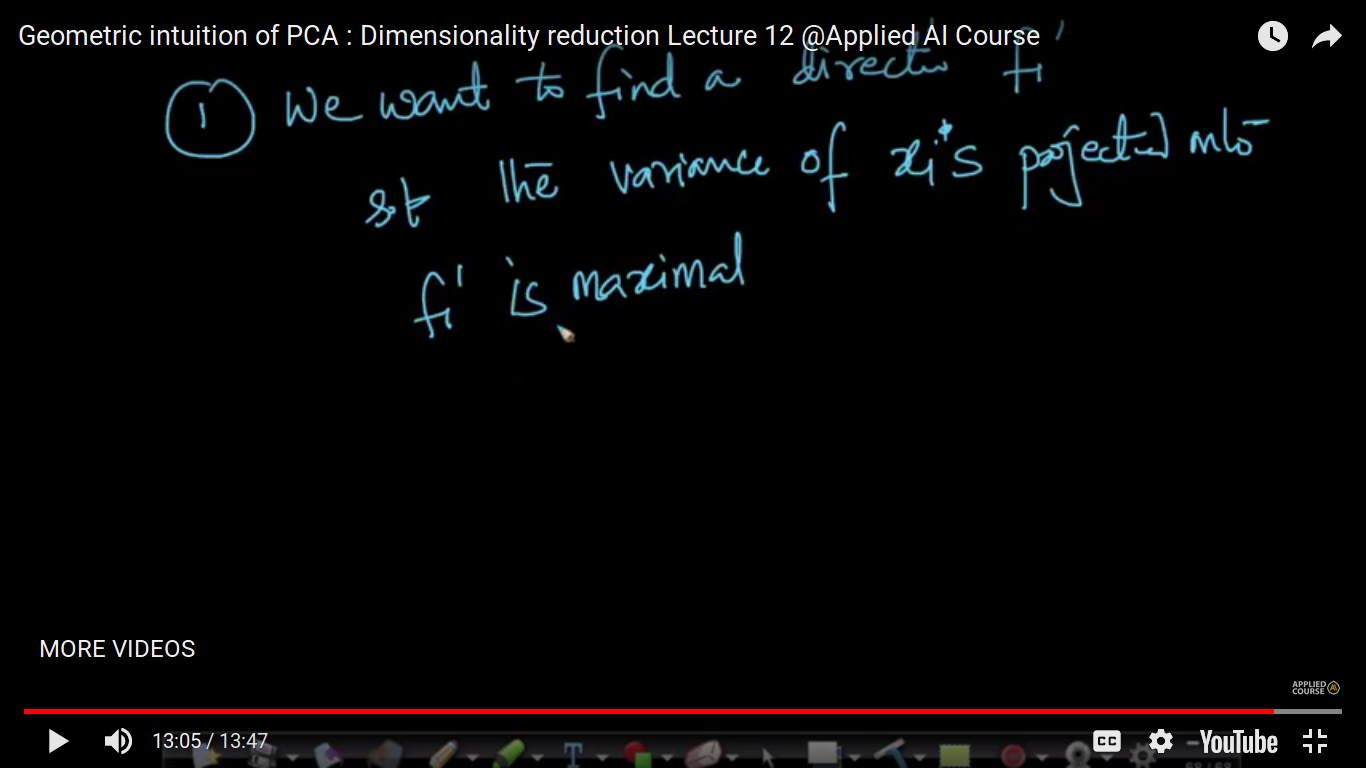
The direction which will tell you the maximum variance.
In PCA, the first Principle component has been rotated in the direction of maximum variance, while the second Principle component is the second most variable direction that is orthogonal to the first PC.
Note:
PCA is essentially a rotation of the coordinate axes, chosen such that each successful axis captures or preserves as much variance as possible.
Blog on PCA:
https://medium.com/@aptrishu/understanding-principle-component-analysis-e32be0253ef0
Página 3
Mathematical objective function of PCA
Here, we only care about the direction of the vector. So, we just take a unit vector(u1) on which if I project any point(xi) on it, the variance will be maximum. So, we have a projection of xi on ui and the projected point on ui is xi'.
D: Dataset
Note that x_i is a vector and not a matrix. x_i corresponds to the d-dim datapoint that is just one of the data points in our dataset/matrix.
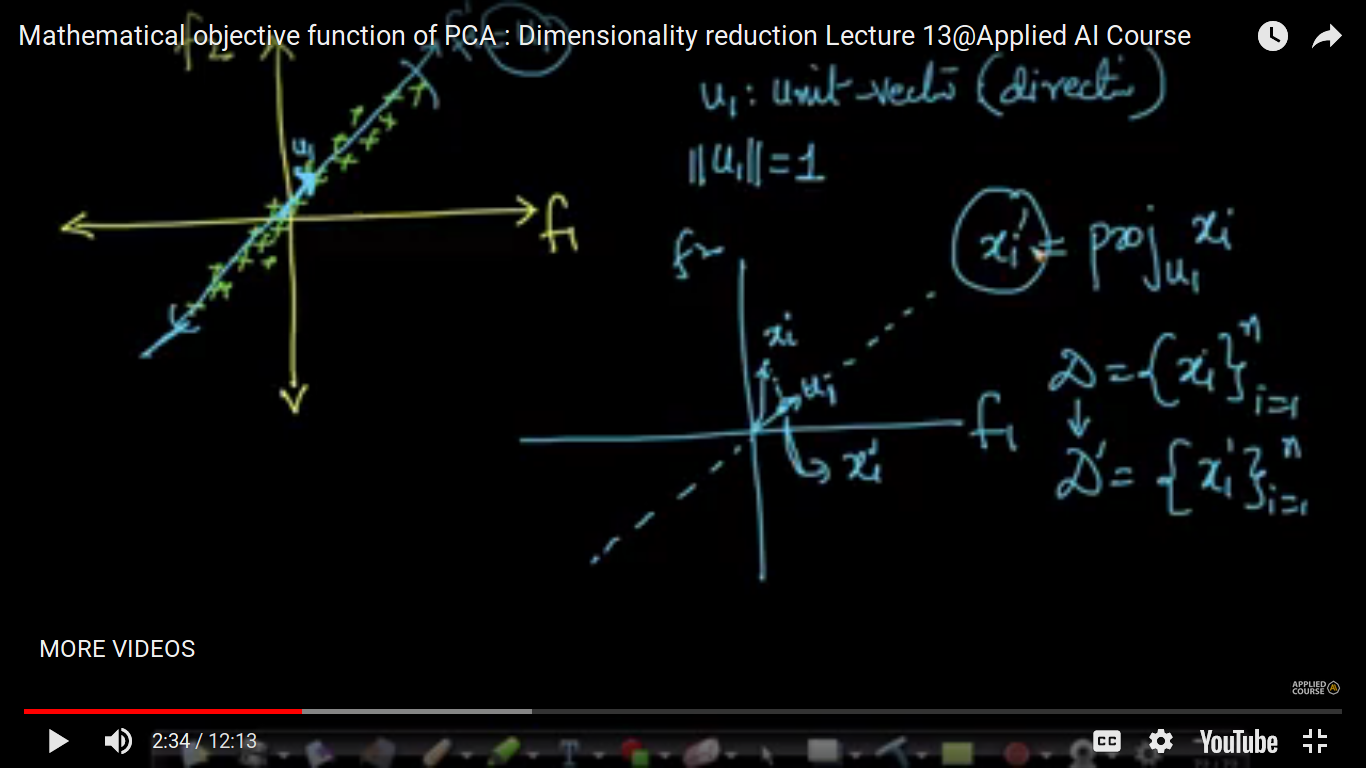
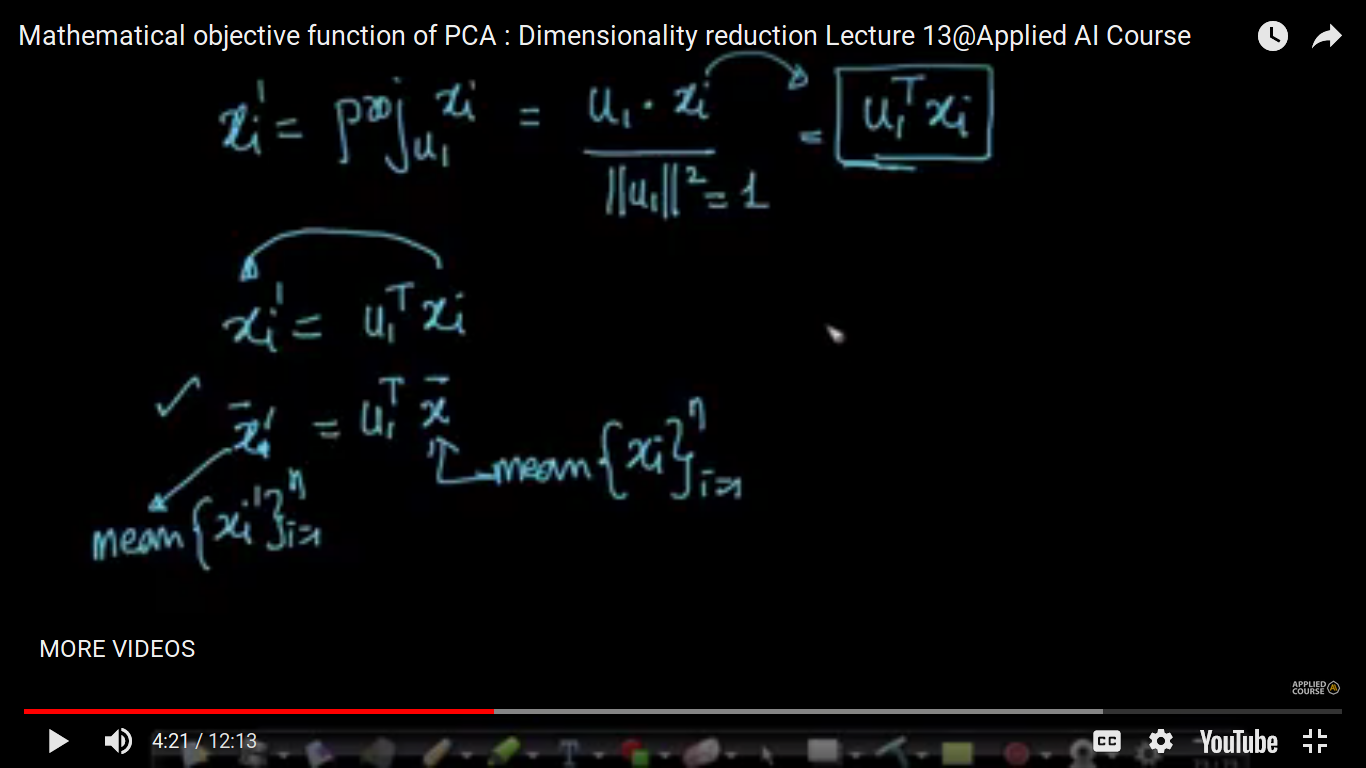
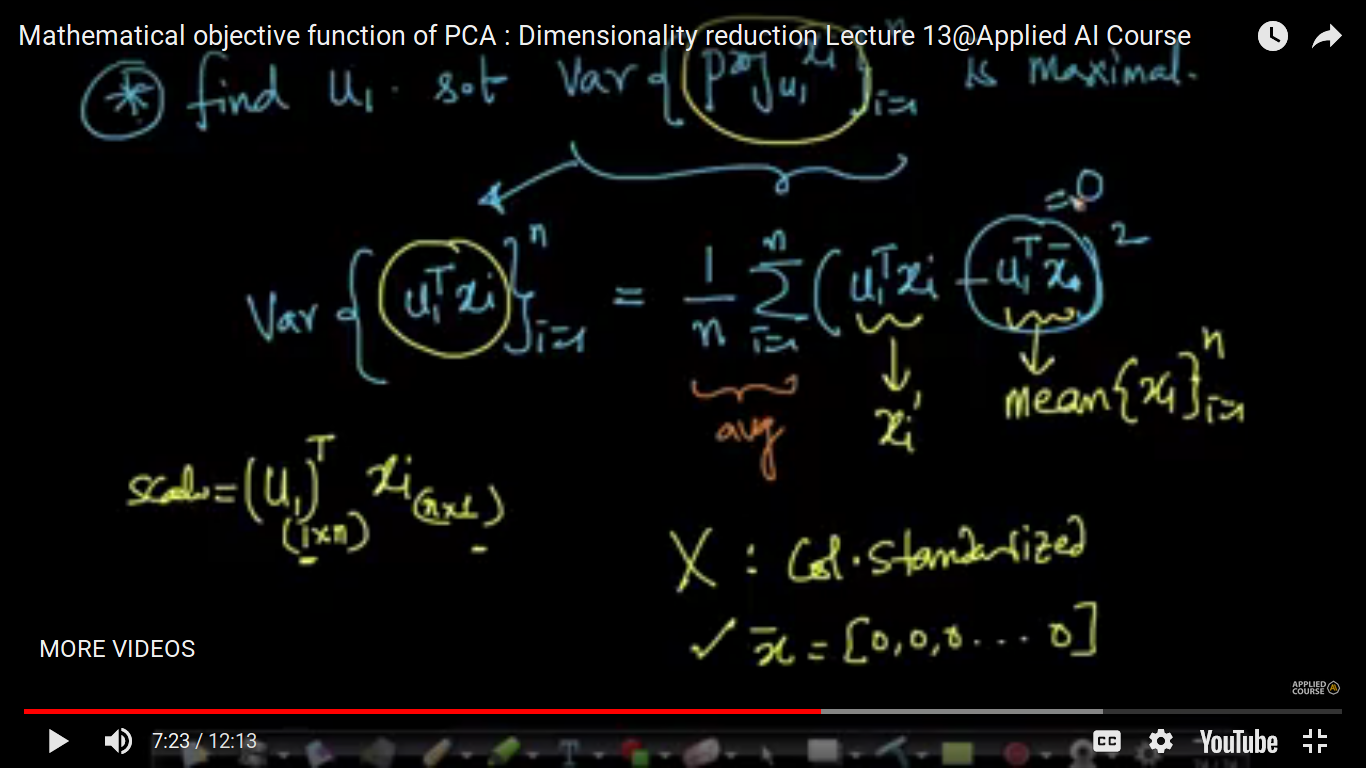
Here, data matrix, xi is given but it is required to find out u1 which is a unit vector. And it is found out in such a manner that var(xi') is maximized.
Q&A:
you have said that for a matrix which is column standardized, the mean of the points =0 and variance =1. why didn’t you consider variance=1 here?
Because we don’t have a term for variance of x_i’s anywhere in these equations. We have the variance of u_1.x_i ‘s which are the projected values and not the original x_i’s and hence not guaranteed to have a variance of 1.
When we standardized x_i’s, we made their variance equal to 1 along the original axis of the data. This does NOT guarantee that the variance of x_i’s projected on any vector(u_1) would be one. If u_i was the x_axis, y_axis or z_axis (original axis) of the original data, then the variance would be ONE for sure as we standardized the data.
So you are saying in a nutshell that if we standardize the data, the variance is 1 only along the previously used axis but not along the other axis but mean is always 0 irrespective of the axis.
Note:
In this scenario, we are actually rotating the ‘x1’ axis in an anti-clockwise direction such that the new data points formed by the projections of the given data points on the new axis will yield high variance. We are least bothered of the magnitude of this newly formed axis. We only need the direction. So we are considering a unit vector( ‘u1’) in the direction same as this newly formed axis by rotating the ‘x1’ axis. (Here the projections of the given data points are made on ‘u1’) So definitely the coordinates of ‘xi_dash’ will change and the distribution of ‘xi_dash’ will have high variance. So we couldn’t say that the mean and the variance of ‘u1’ are the same as those of ‘x1’.
Mean and variance will be different after rotating the axis. Because we are choosing the direction which has the highest variance
As far as I read in vectors, a normalized vector is formed by
a/sqrt(sum of each component), if a is a vector
How this
normalization is different from x-xmin/xmax-xmin?
Answer:
Normalization is a very commonly used term in linear algebra which is used in different contexts with different meanings. It can get fairly confusing.
1. In the context of normalizing a vector i.e, your example, we are converting a vector into a unit vector by dividing it by its magnitude. this is vector-normalization.
2. The min-max transform is a feature-normalization NOT a vector-normalization.
The components of the vector that we get after projecting each of the points onto the top eigen vector would be the 1-D representations of the points. Now we compute the variance in these 1-D data points represented in the vector. There is no meaning to computing variance of a vector unless the vector contains the 1-D datapoints or observations
https://soundcloud.com/applied-ai-course/1-d-points-pca/s-XdUEz
Página 4
Alternative formulation of PCA: Distance minimization
Previously, we saw one of the formulations of maximizing the variance of PCA by calculating u1 first such that it maximizes projected variance.
So, there is an alternative formulation called distance minimization formulation.
So, In the projected variance formulation we saw that this is the optimization problem we are solving with the objective function and some constraint.
Now, we are discussing distance minimization formulation - lets we assume that our data is Column Standardized as same as in the previous topic.
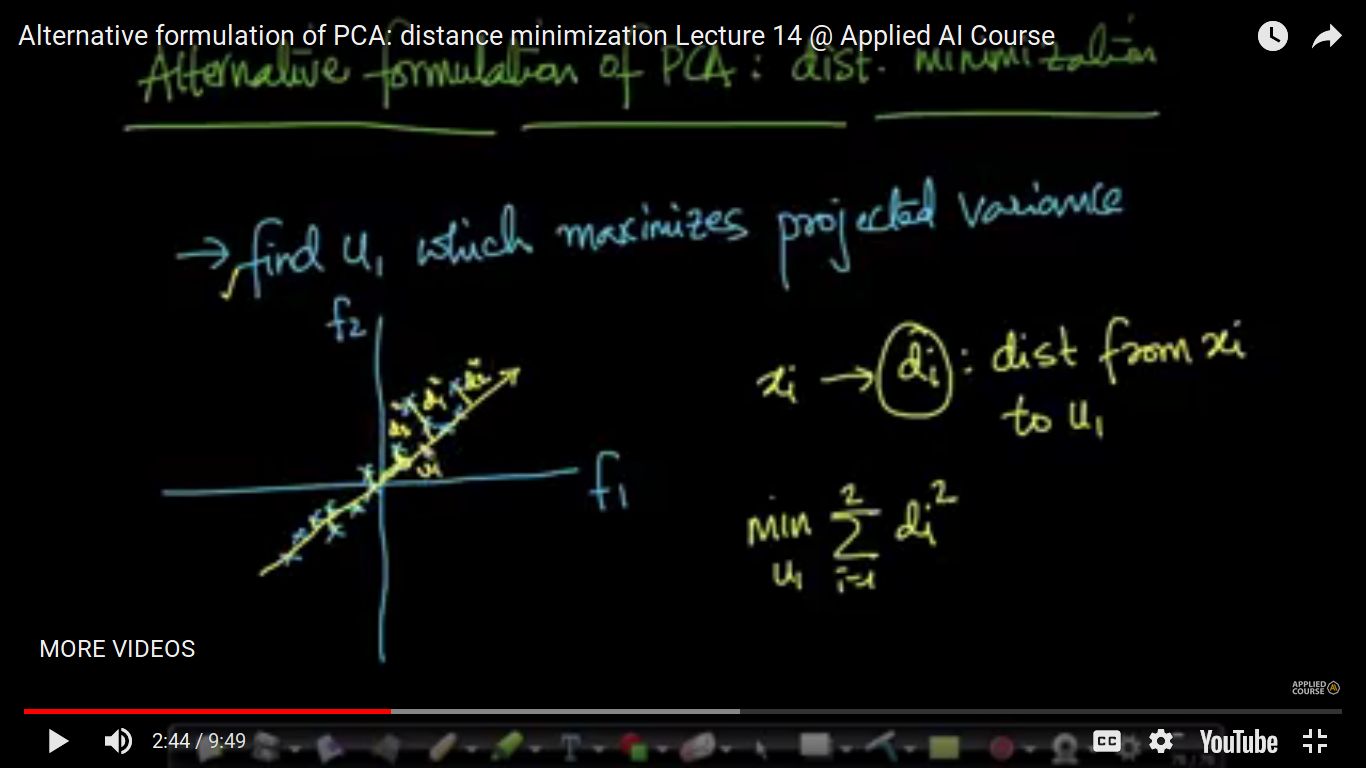
The above formula represents distance minimization formulation of PCA. So, we are trying to find u1 such that summation all the distance square of the points, Xi should be minimized.
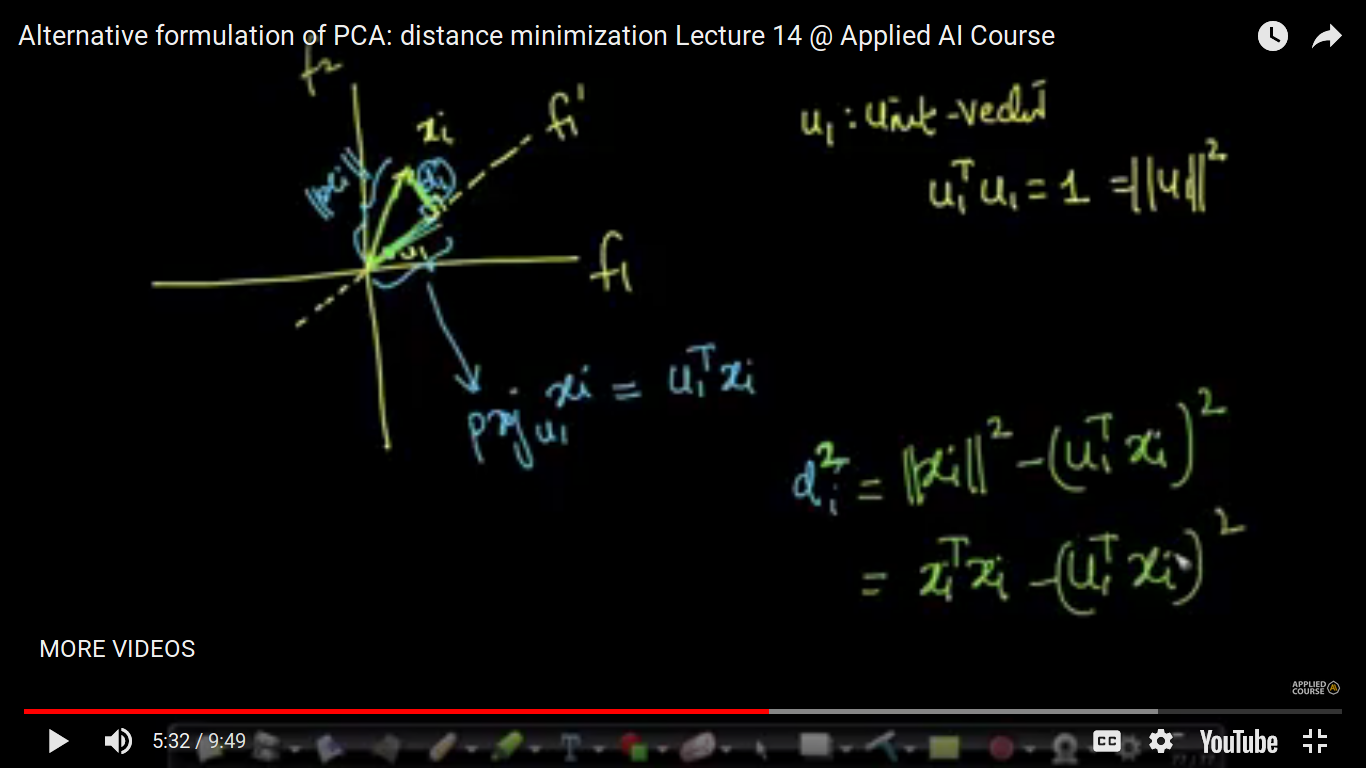
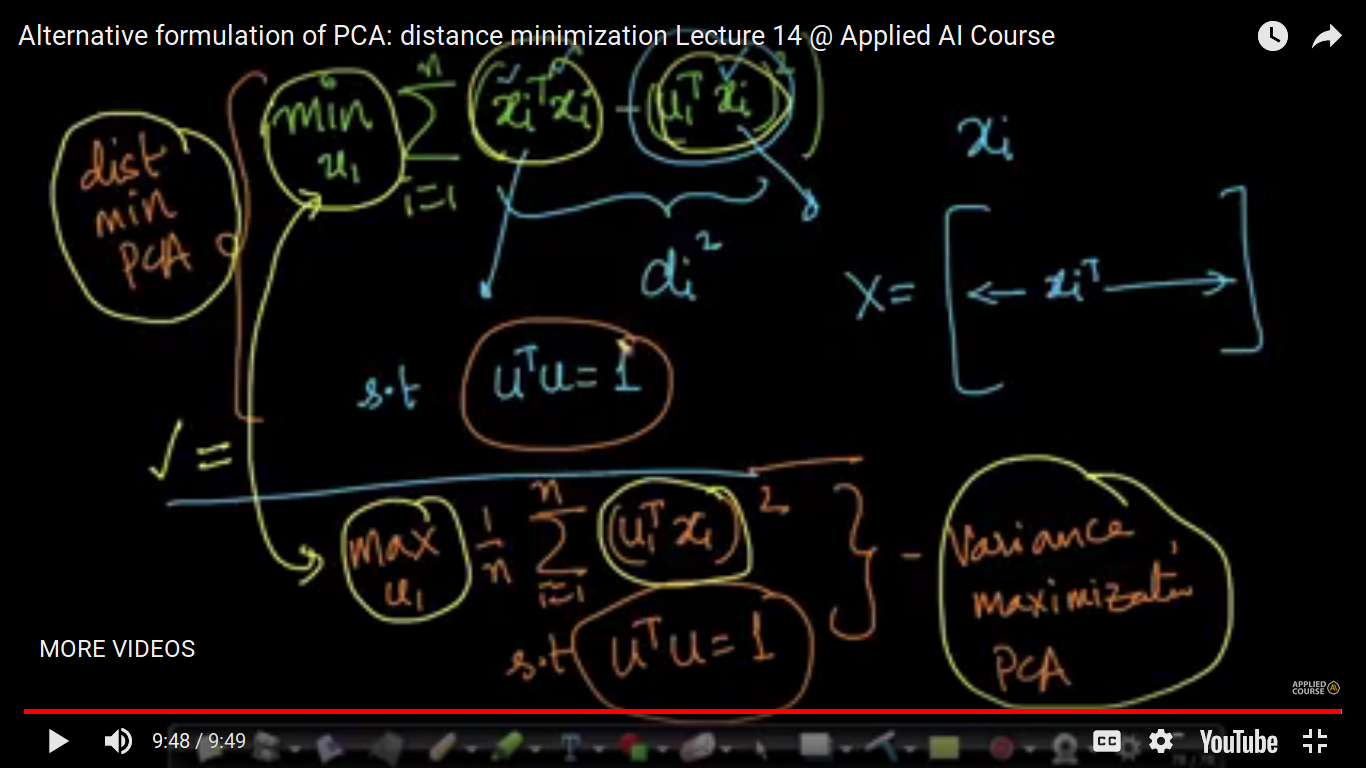
Here, we just introduced another formulation of PCA but the exact process of solving this problem will see it when we learn Optimization.
Página 5
Eigen values and Eigen vectors (PCA): Dimensionality reduction
How to reach to the solution of Optimization problem will be discussed later. Now, we will discuss the solution.
X: Data Matrix
Column Standardization: variance or standard deviation of each column or feature is 1.
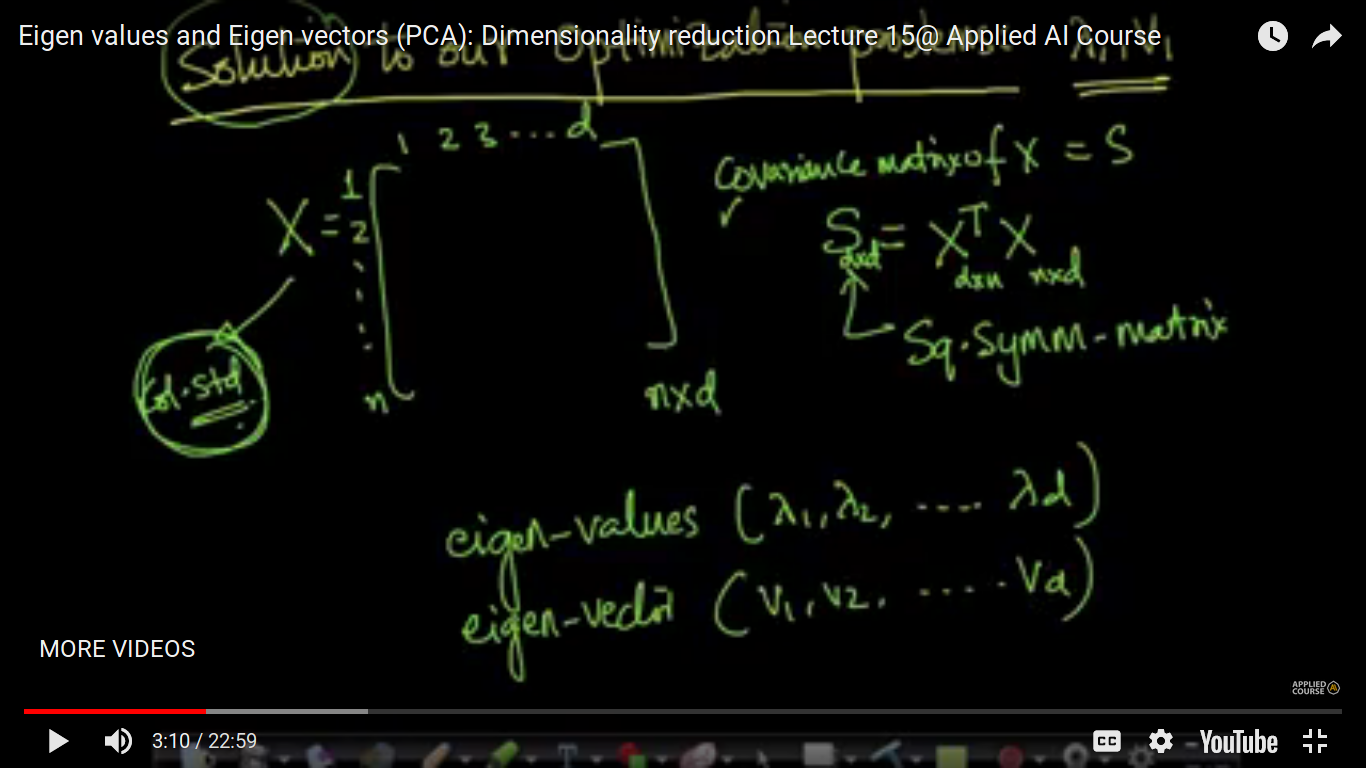
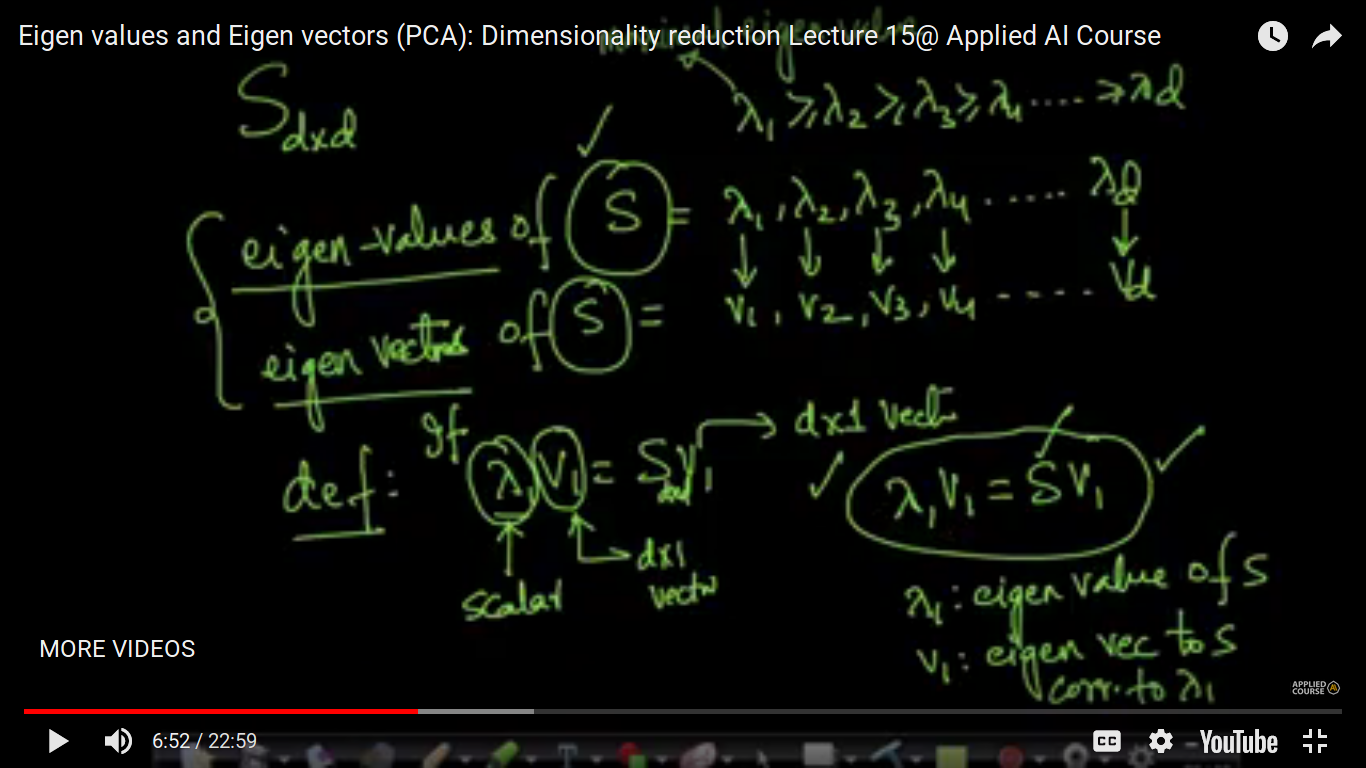
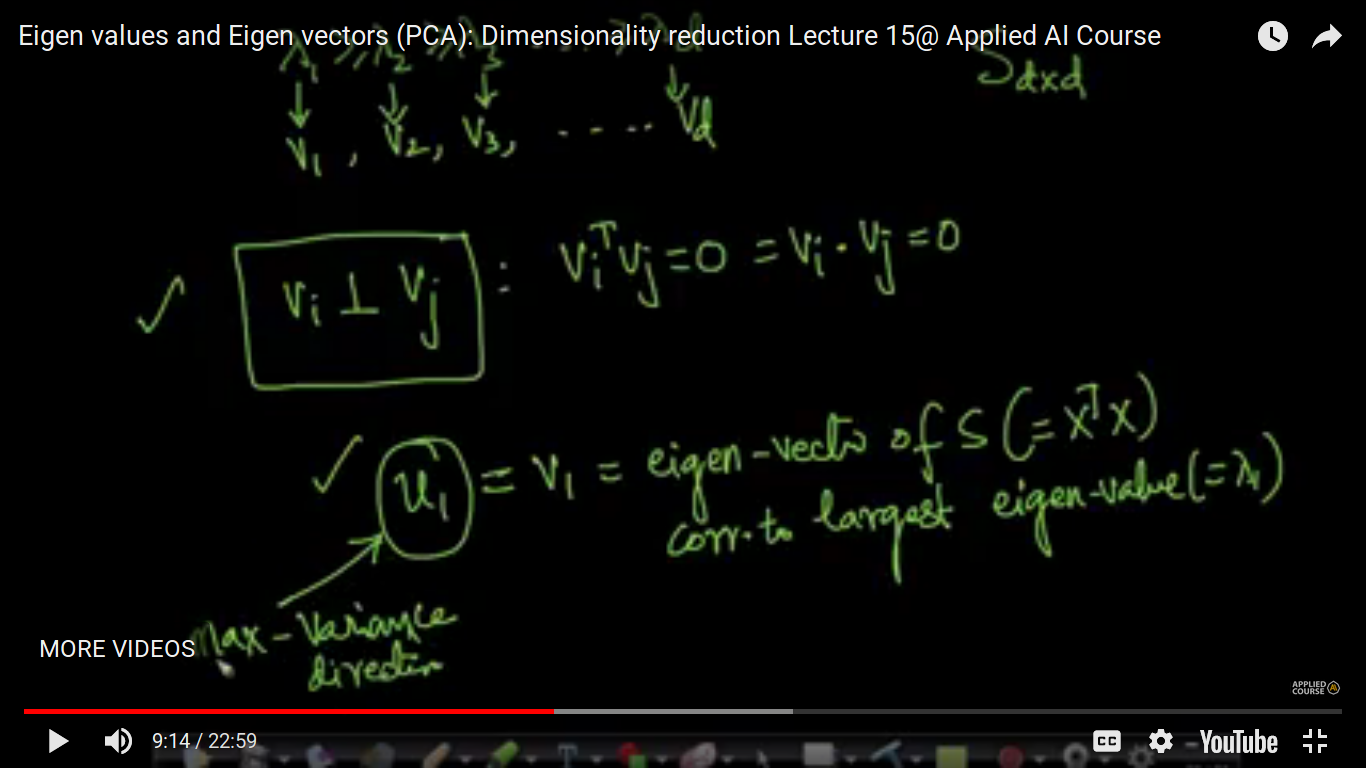
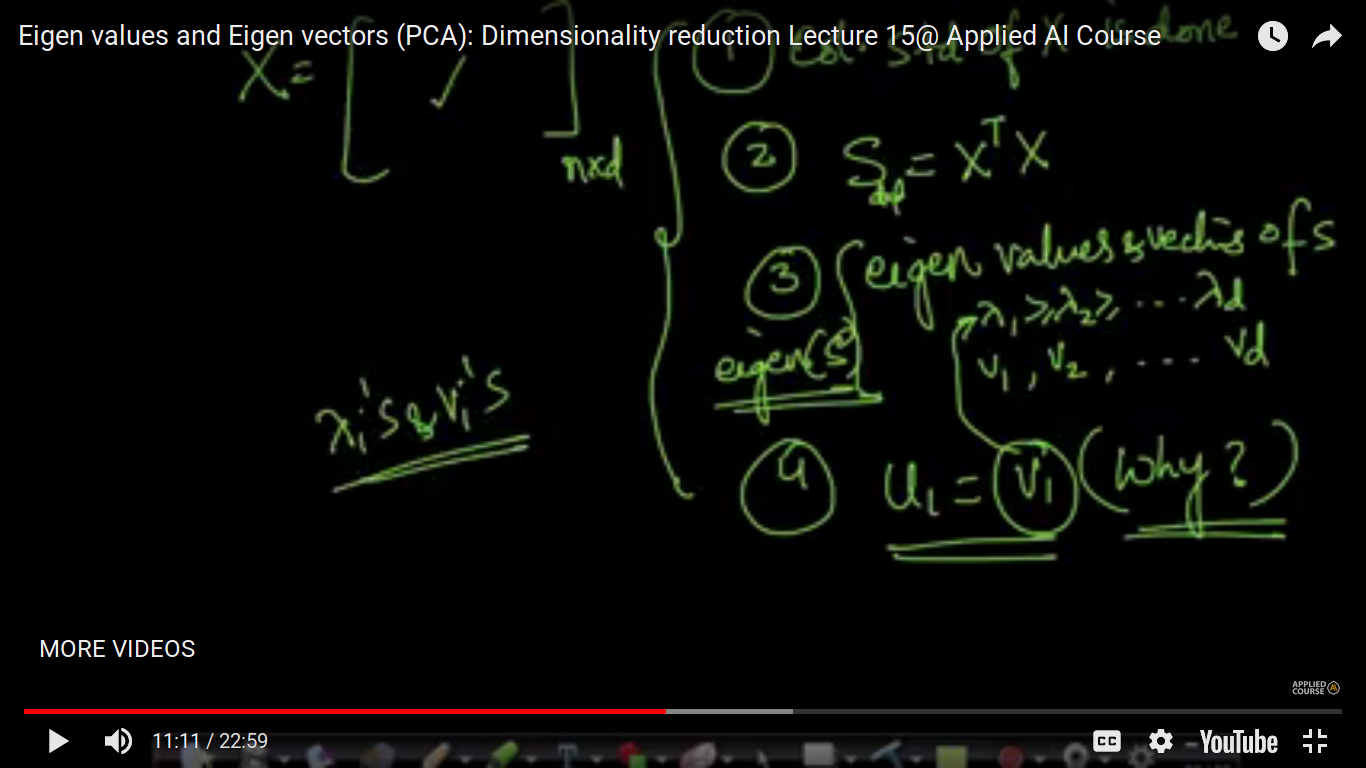
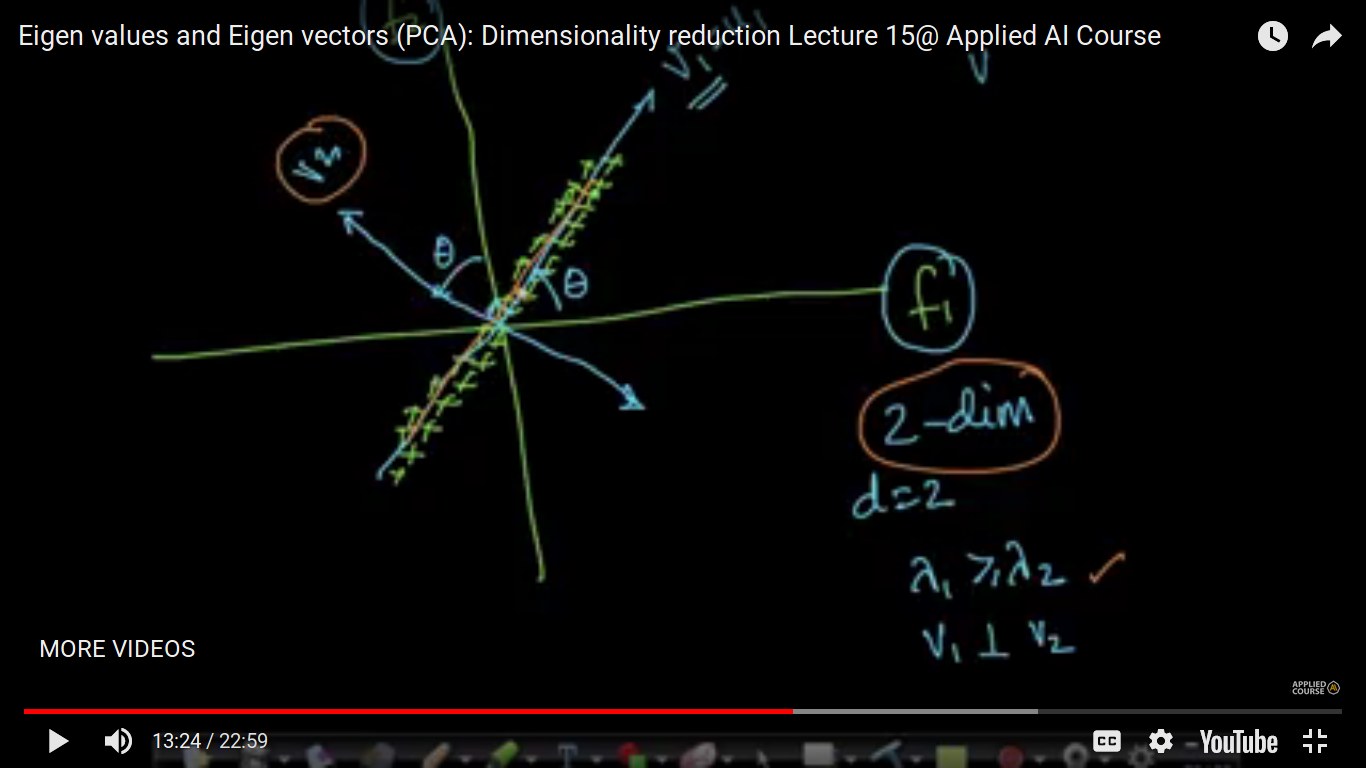
Here, we have rotated an axis in such a manner that the Eigen Vector v1 is in the direction where we found maximum variance. So, we understood the geometric intuition of vi, hence we will now discuss lamdas.
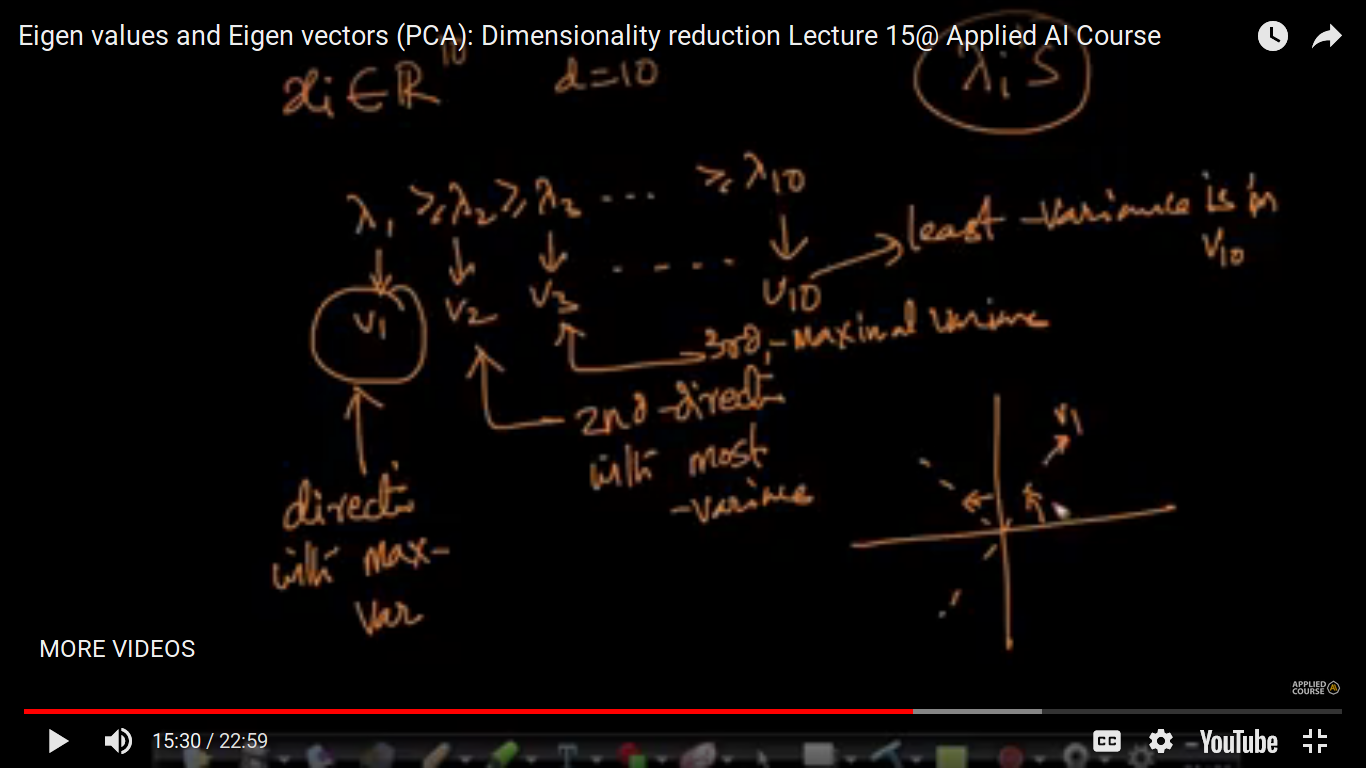
Now, let's see the intuition of lamdas by the various example below.
Example 2:
First Calculate lambda1/(lambda1+lambda2), we get the value 3/4 which means if I project all of this data onto v1 and if I discarded v2 in order to convert 2-D to 1-D projection and I choose v1 as a direction of chosen on which I am projecting all the points, So I am going to conserve or explain or going to retain 75% of the information we got. And this is because there is a considerable amount of spread i.e number of points are spread from the v1 and hence on projection, there is a loss of information and it would be 25% in our case.
Note:
As the spread increases, the value of lambda1/(mbda1+lambda2) decreases. Hence the loss of a percentage of information is more.
So, lambda gives us the relative scale.
And value lambda1/(lambda1+lambda2) gives the percentage of variance is retained.
Here, lambdas are eigen-values and v1, v2 are eigen vectors.
So, this is the geometric interpretation of Eigen values or Eigen vectors.
Página 6
PCA for Dimensionality Reduction and Visualization
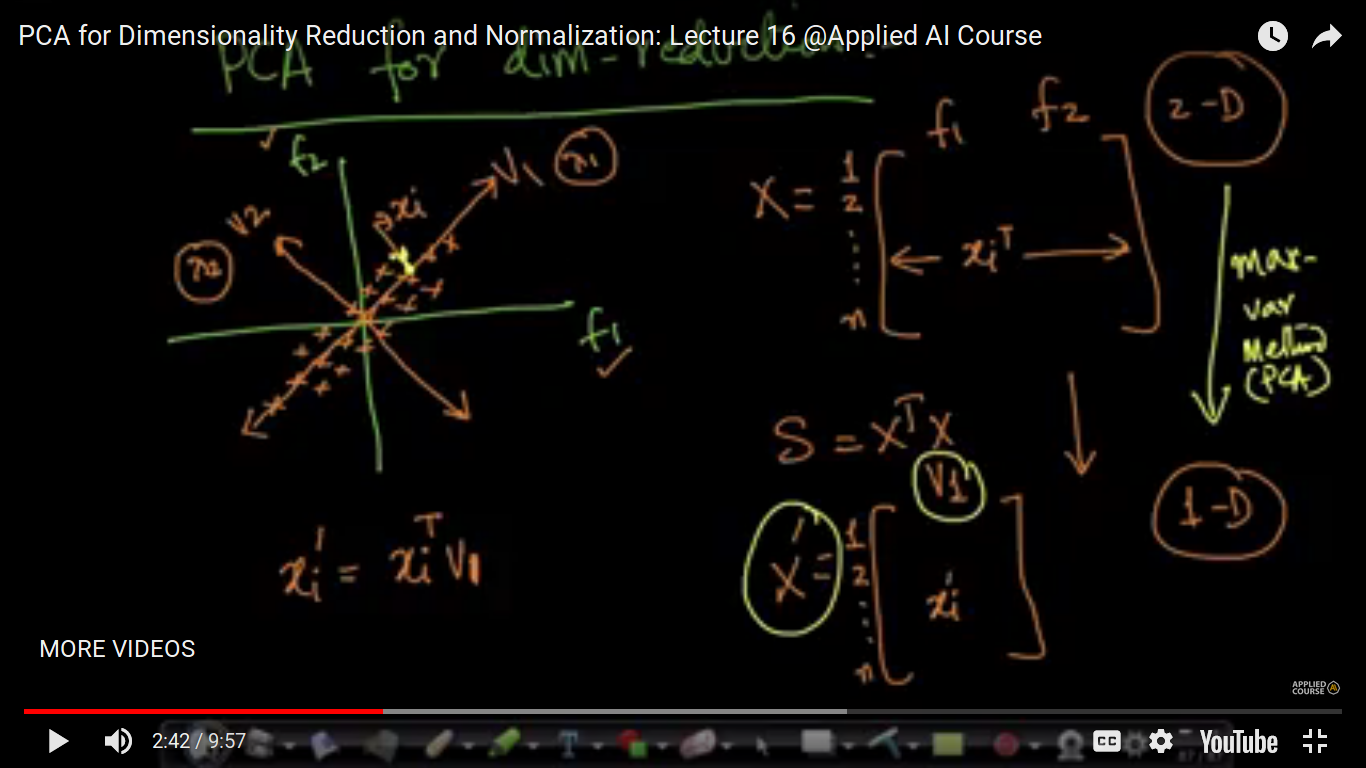
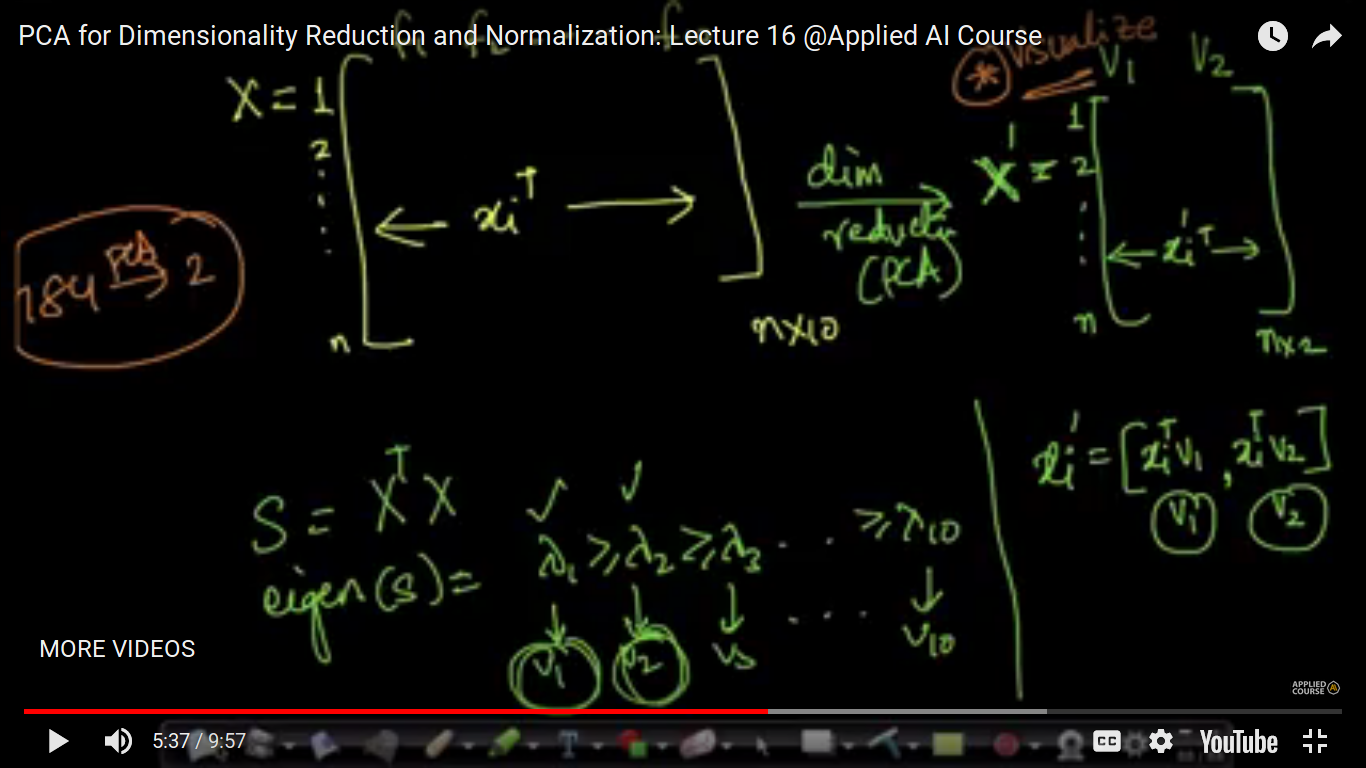
We have to project all our points in the direction of V1 because of maximum variance found in this line.
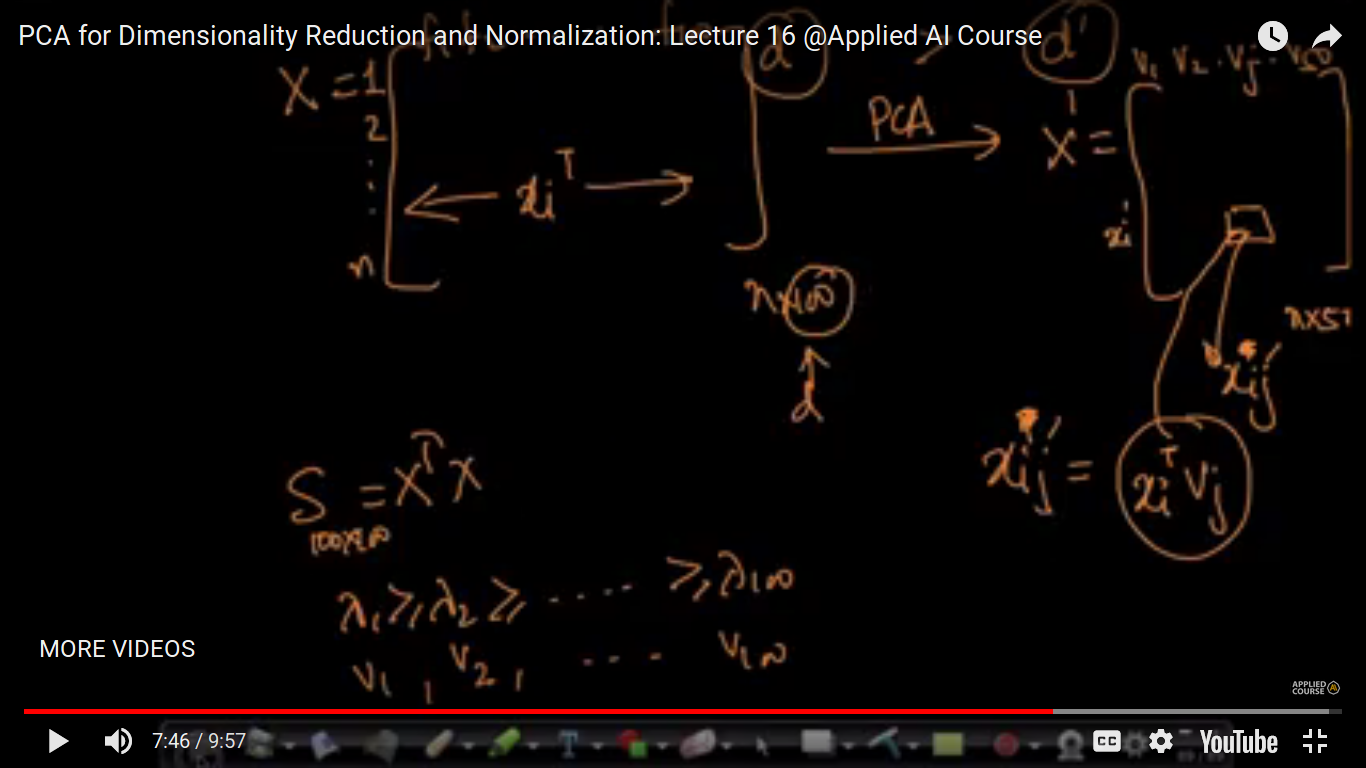
Now, we are taking nX100 matrix, X and convert into X' with nX50 dimensions using dimensionality reduction of PCA where all the columns are eigen- vectors v1,v2...
Q&A:
I have a doubt. We were told in the lectures that
“More the number of dimensions reduced, more the information is lost”.
At the beginning of the topic Dimensionality Reduction, we were told that the main objective of Dimensionality Reduction is “To make the dataset more convenient for Visualization and Interpretation by reducing the dataset into 1-D, 2-D forms.
The questions here are as follows:
What is the use of the Visualizations and Interpretations that are made out of this reduced datasets where the information is lost? Do they always help us in making an accurate analysis and achieve accurate results?
Answer:
1. visualizing higher dimensional data can help see understanding the results from the model and thus help make improvements to the model. Note that It doesn’t give always accurate result
Question:
I have a fundamental doubt, let’s say we have 100-dimensional data, and u arrange the vector v’s in descending order in X’.
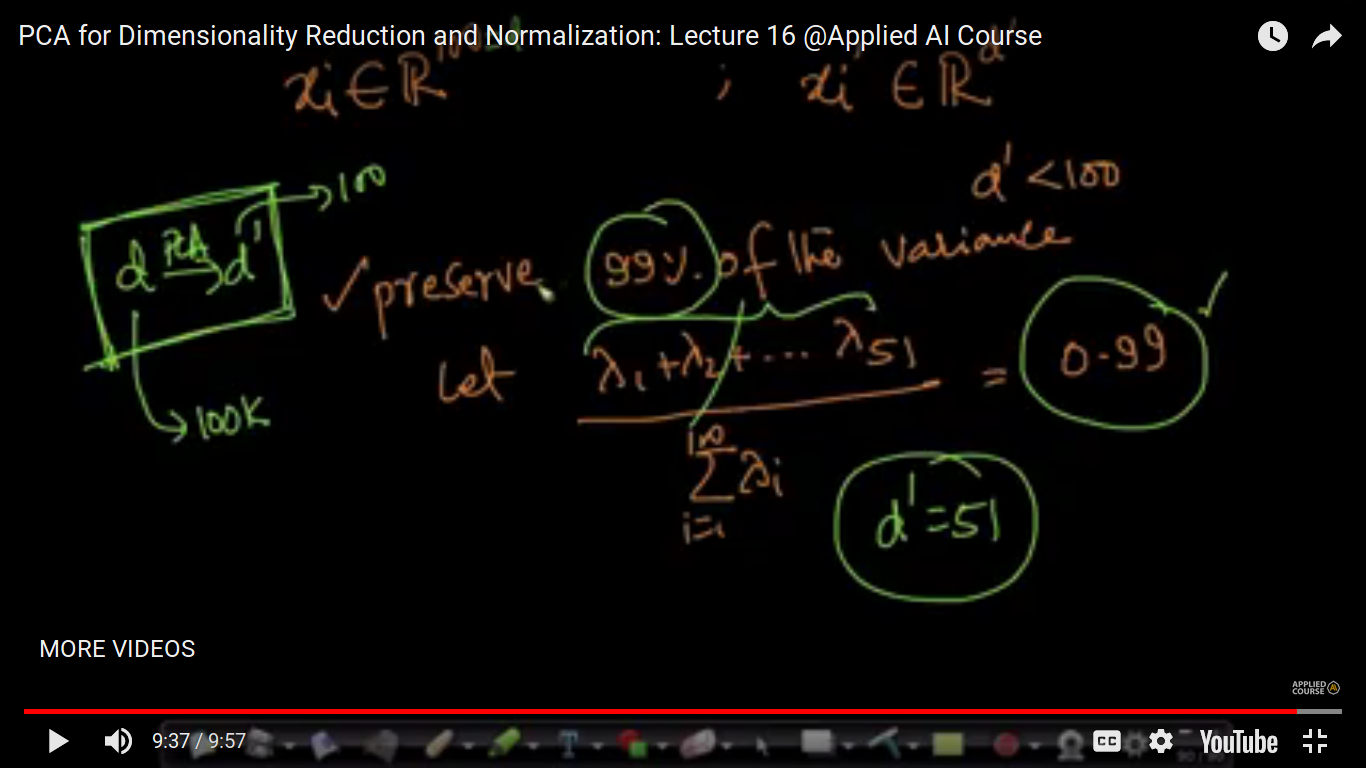
Now in X’, how do we know how many dimensions to consider in order to preserve 99% of the original data?
Answer:
With the help of eigen-values, we can find out the percentage of variance preserve
(or)
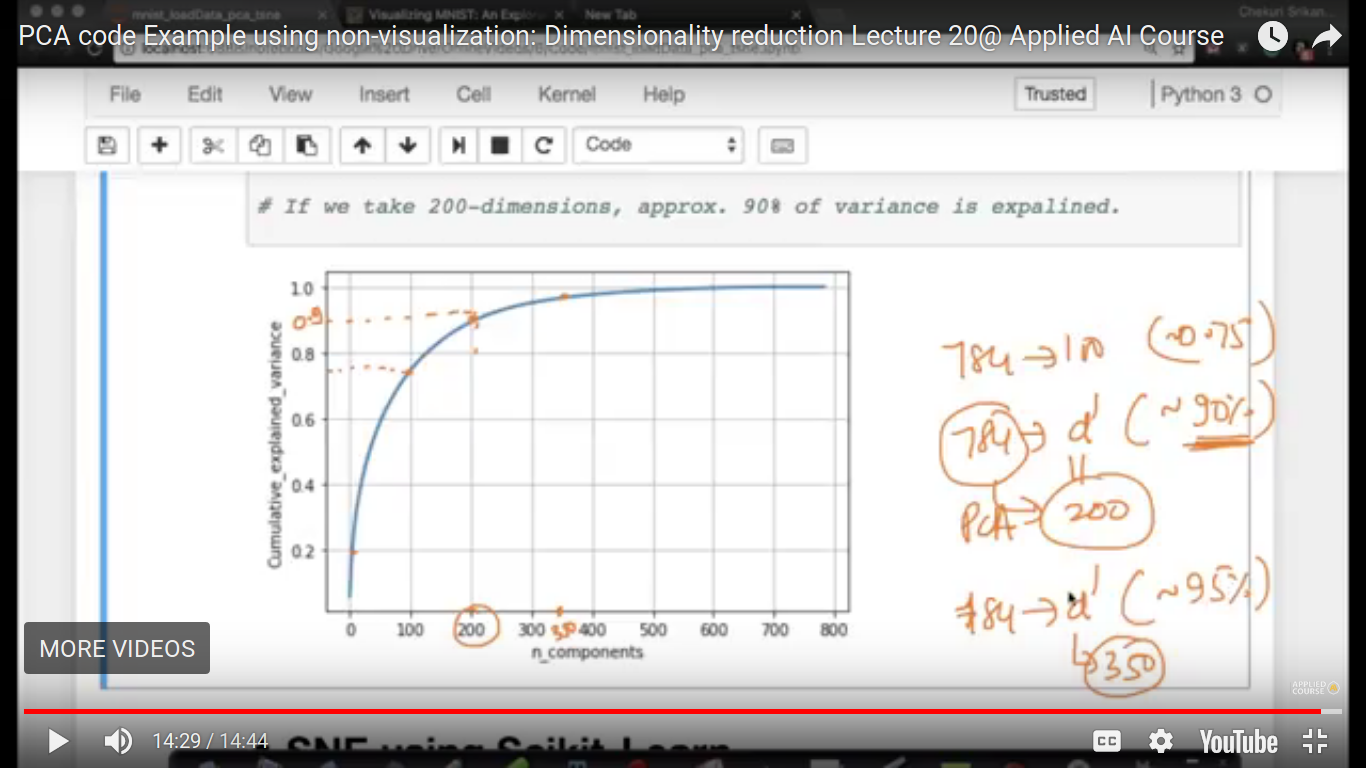
You can plot a CDF graph and you can roughly estimate the number of dimensions is required to preserve 99% of the data.
We have discussed it with an example in the following video: https://www.appliedaicourse.com/course/applied-ai-course-online/lessons/pca-code-example-using-non-visualization/
Question:
Hi team, how do we calculate eigen values and eigen vectors from the covariance matrix?
Answer:
Please check out documentation of numpy eigh, https://docs.scipy.org/doc/numpy-1.14.0/reference/generated/numpy.linalg.eigh.html
Question:
what are the criteria for selecting no of principal components
Answer:
We can pick the top-k eigen-vectors that explain, say 95% or 99% of the variance as explained in this video.
Whether we choose 95% or 99% or 90% is a problem and context-specific on how much variance we want to preserve while reducing the dimensionality.
Question
you have taken the conversion of higher dimension data into 2D. Why can’t we take 1D? Does the information lost is more in 1D than 2D?
Answer:
You can project onto 1-D also. Of course, information lost in 1-D is more than 2-D which is more than 3-D and so on.
Q:
Q1.Please correct me if my understanding is wrong. PCA is all about rejecting directions on which variance is low. So if we are converting 100d to 3d by rejecting 97 directions where data is spread are we not missing out information?
Q2. Also can you please brief why the spread of data is information, like an example to understand this statement better.
Answer:
1. Yes, we will lose some information as measured by variance. But it would be small as we are picking the dimensions which preserve most of the variance. additionally, PCA facilities visualization of high-dim data and using models which may not work well on high-dim data.
wherever you have written, S=X^T.X should be S=X^T.X/n…..(Co-variance matrix). Yes
Página 7
Visualize MNIST dataset
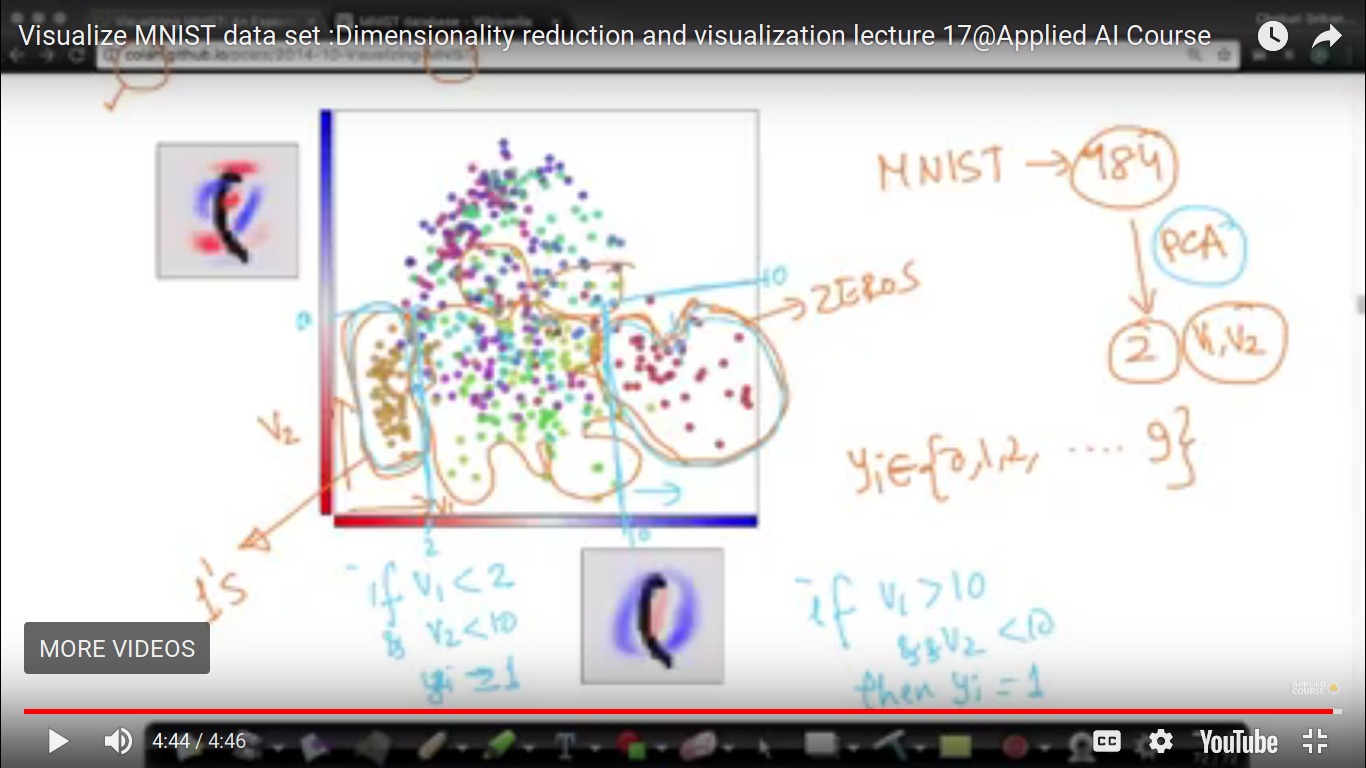
Here, 1's and 0's are well separated but others are not. So, using PCA for dimensionality reduction shows weaker in that case because we are not able to visualize the data in 2-D which are not well separated. So, t-SNE is helping out in the next topic.
Q:
I didn’t understand how the system understood the 784 dimension data and classified it as respective digits. Can you please help me with this.
Answer:
The system did not understand the digits visually. It so happens that the digits are very distinct when they are in a 784-dim space as each digit’s representation is fairly unique in this space. All we are doing is to project the 784-dim data into 2-D to facilitate our visualization as we cannot see anything above 3-D.
Página 8
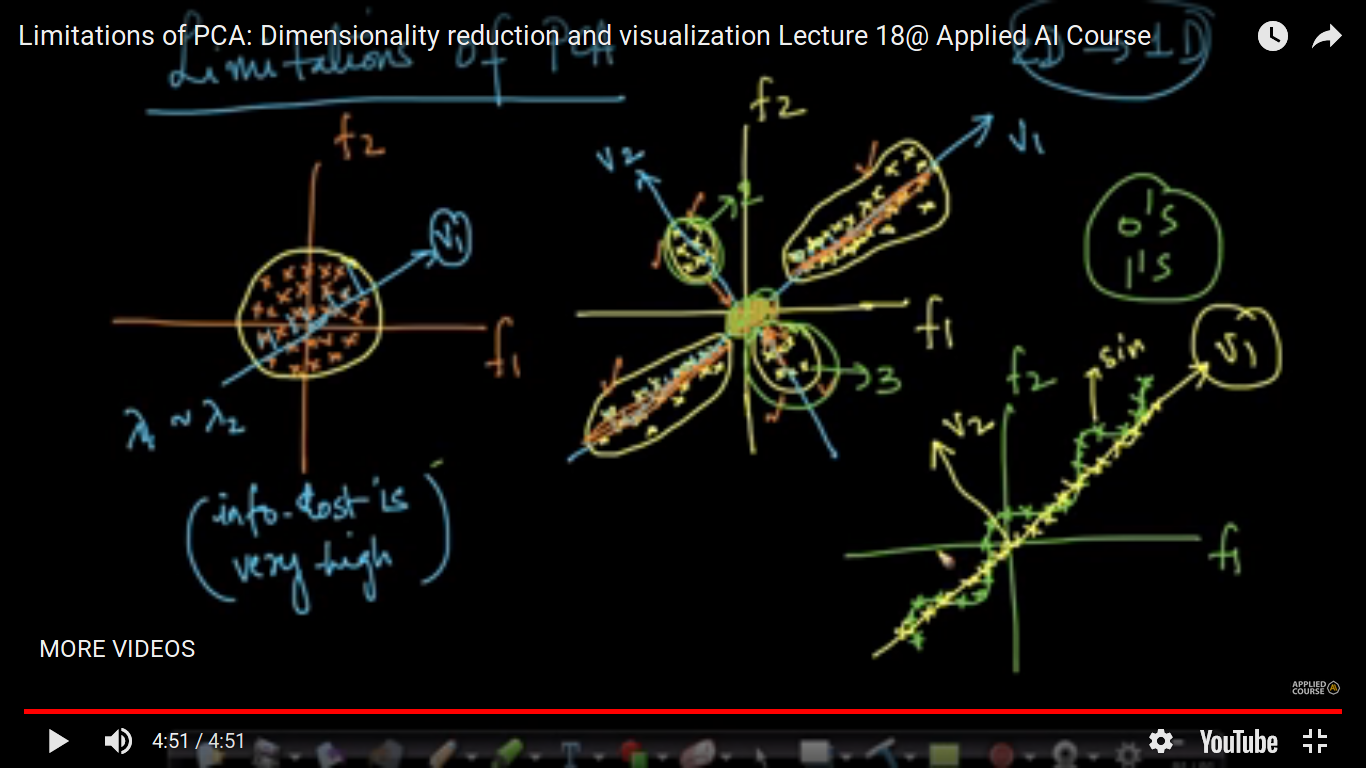
Limitations of PCA
Here, we have seen 3 Examples where PCA fails.
Example 1: Here, the projection of all the points on v1 creates a loss of information when all points are spread in the form of a square.
Example 2: Initially on v2, two clusters are well separated but after applying PCA i.e on projecting all the points on v1, t is accumulated at the single place i.e at the middle creates a loss of info.
Q:
n the last plot which looks like a sine wave, why is losing a structure/design of the plot a limitation of PCA although we have all the data points and can convert to 1-D?
Answer:
While we can project the points onto a 1-D plane/line which is 45-degrees, we are obtaining a bunch of points on a line. We have completely lost the actual structure, the sine-wave, of the original data. The objective of any visualization is to capture as much structure of the original high-dim points as possible in the low-dim space.
Página 9
PCA Code example
All the code is written in IPython file.
Página 10
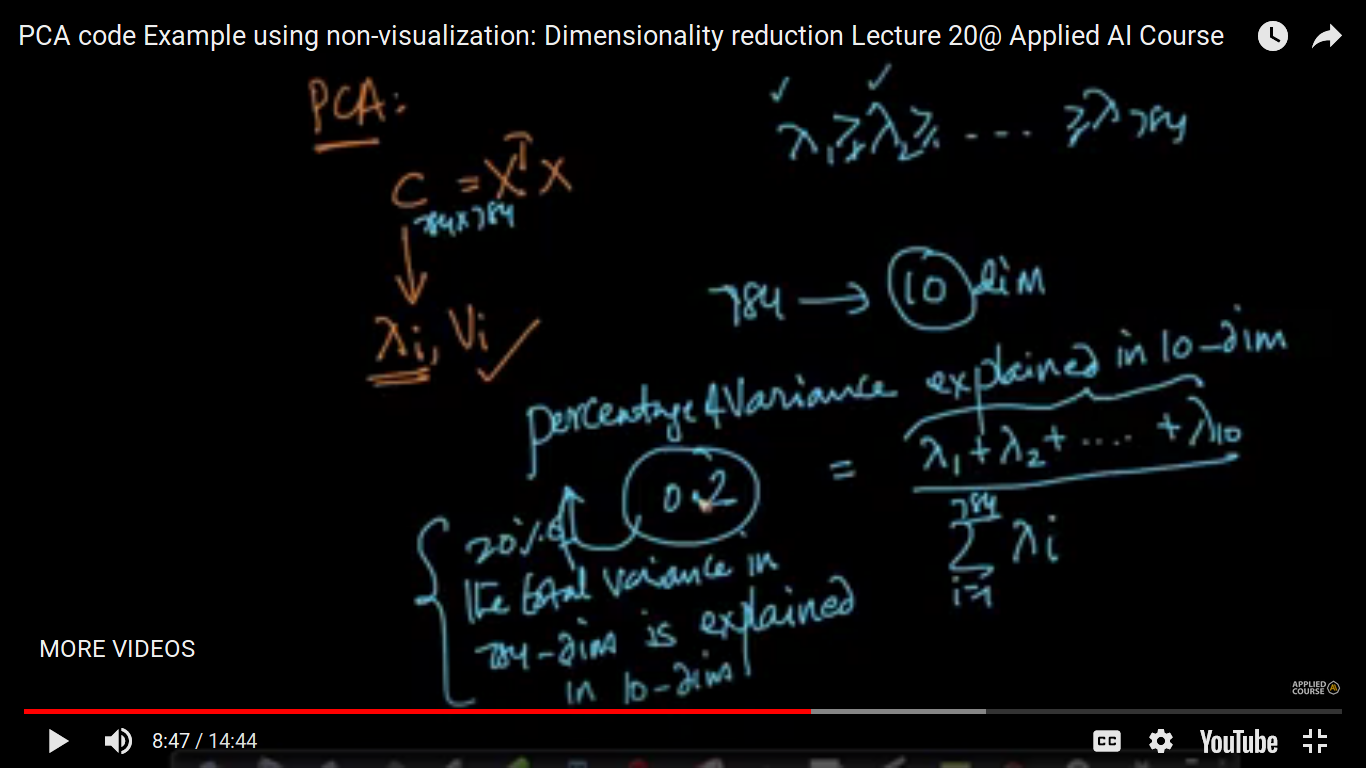
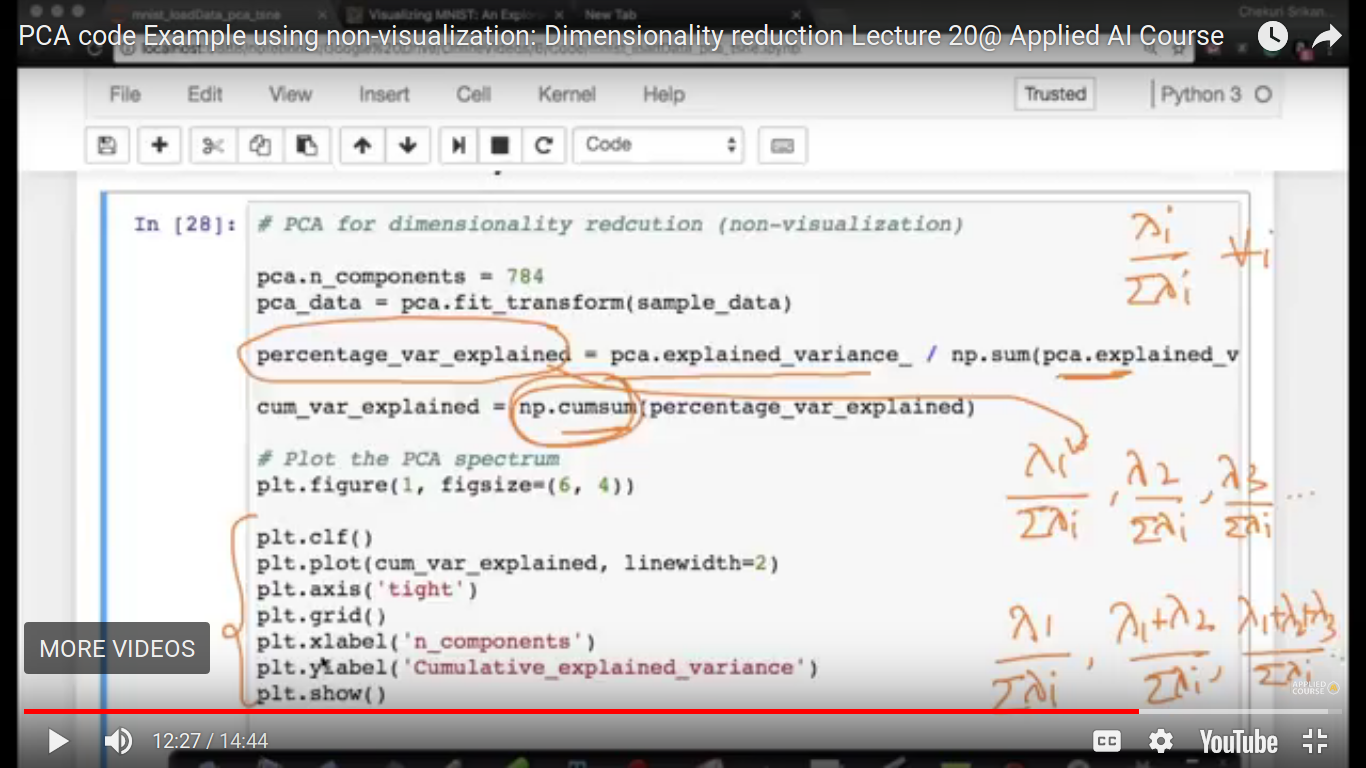
PCA for dimensionality reduction (not-visualization)
When we are converting 4 dimensions to 2-D i.e into 1st and 2nd principal component. So, this is one of the applications of PCA in data visualization.
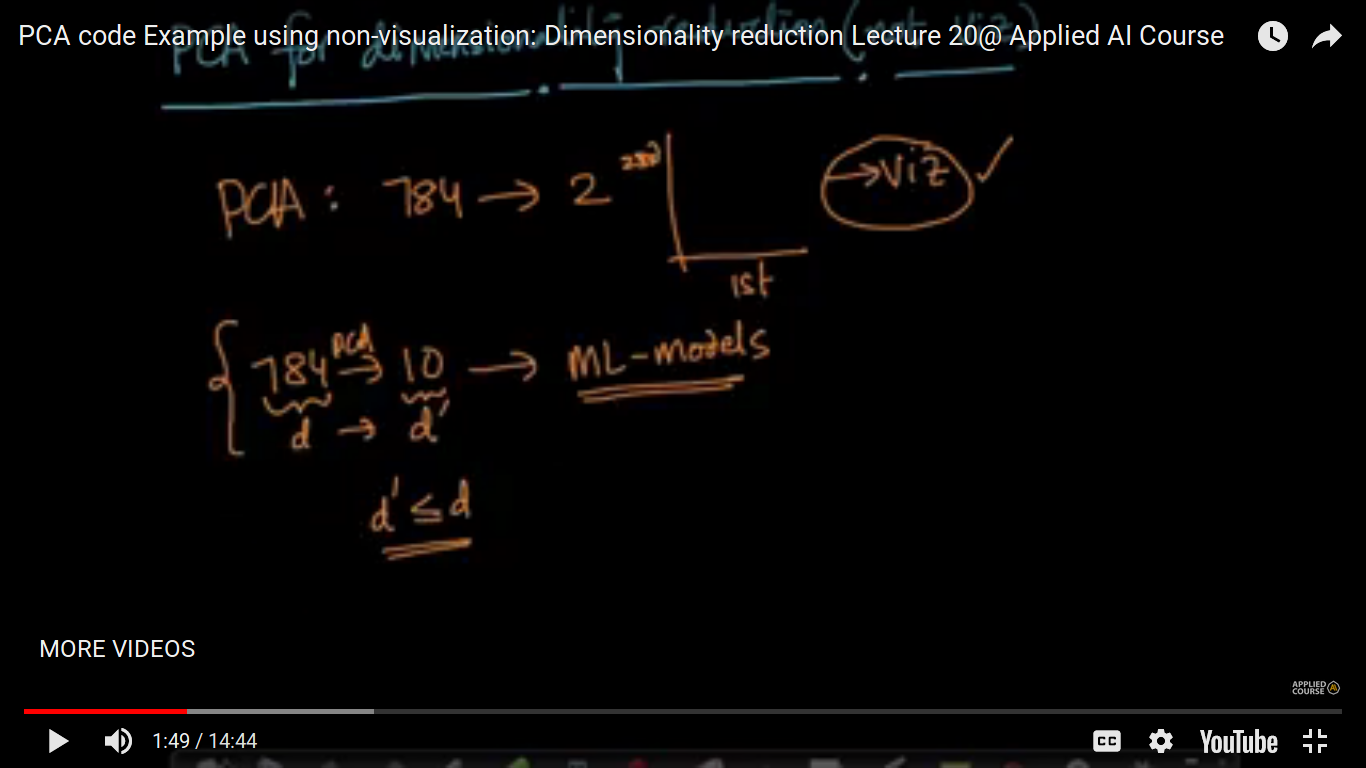
But there are other applications of PCA where we have to convert 784 dimensions to 10 or 100 or 200 i.e. something greater than 2 or 3 dimensions using PCA. And this application is seen when we are training machine learning models. Hence, this application will be discussed later.
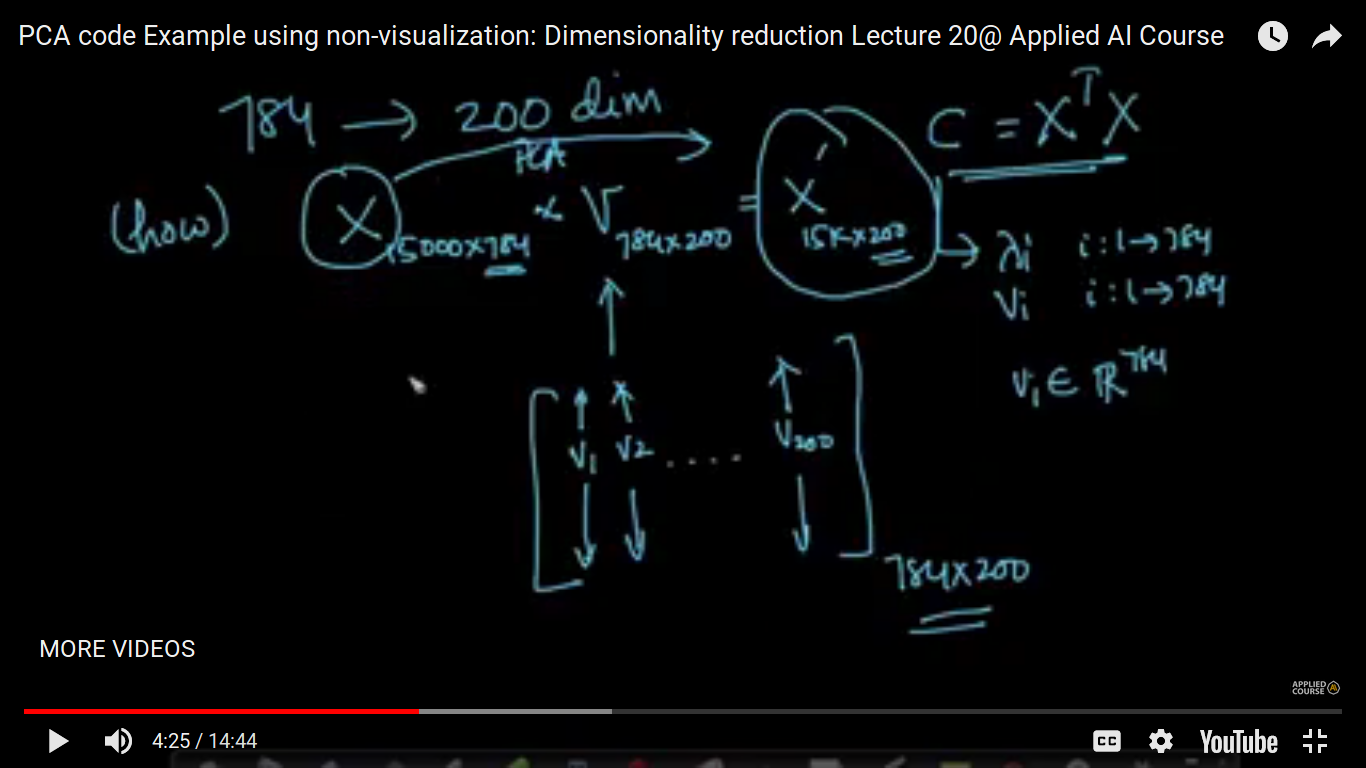
Here, V is composed of 200 eigen vectors.
C is a covariance vector of X.
lambda(i) is eigen values and vi is eigen vectors.
So, PCA in its core is Variance Maximization Technique.
Note: variance is a nice measure of the information.
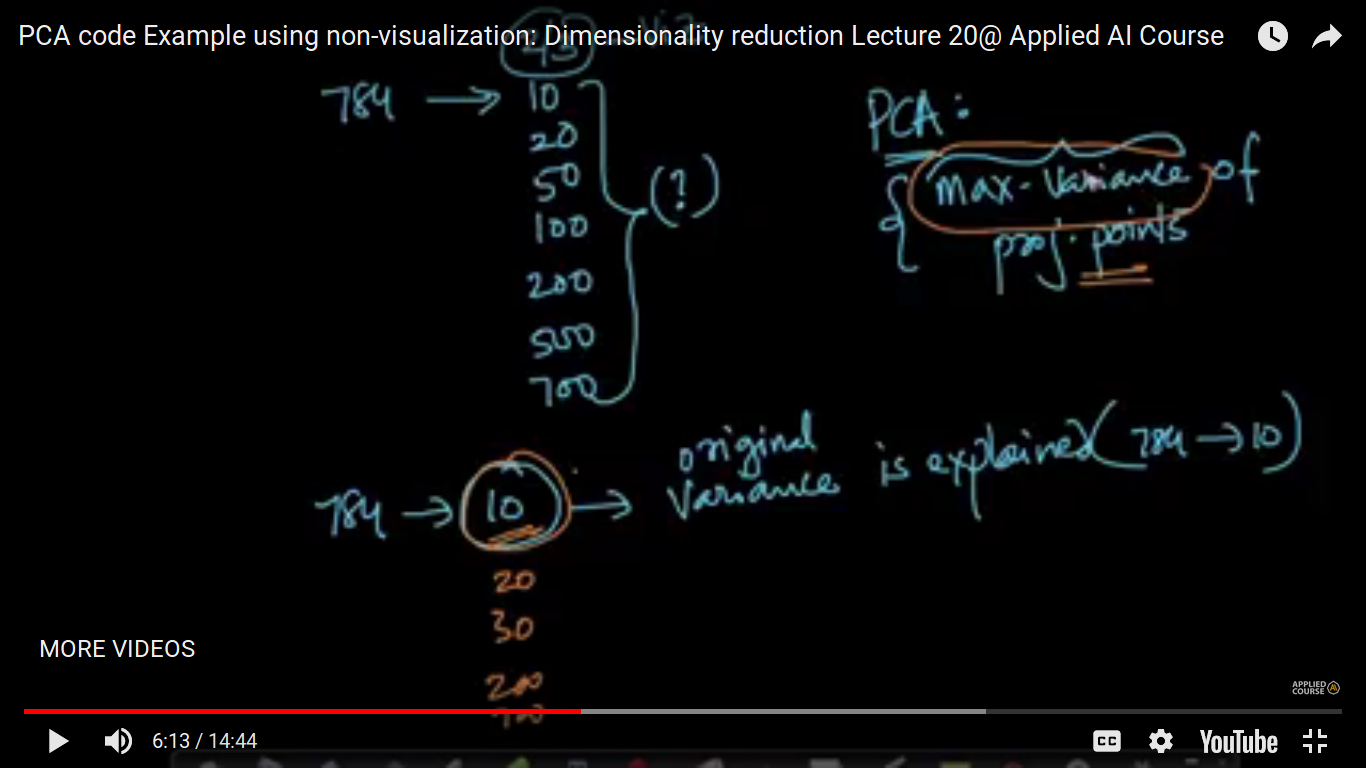
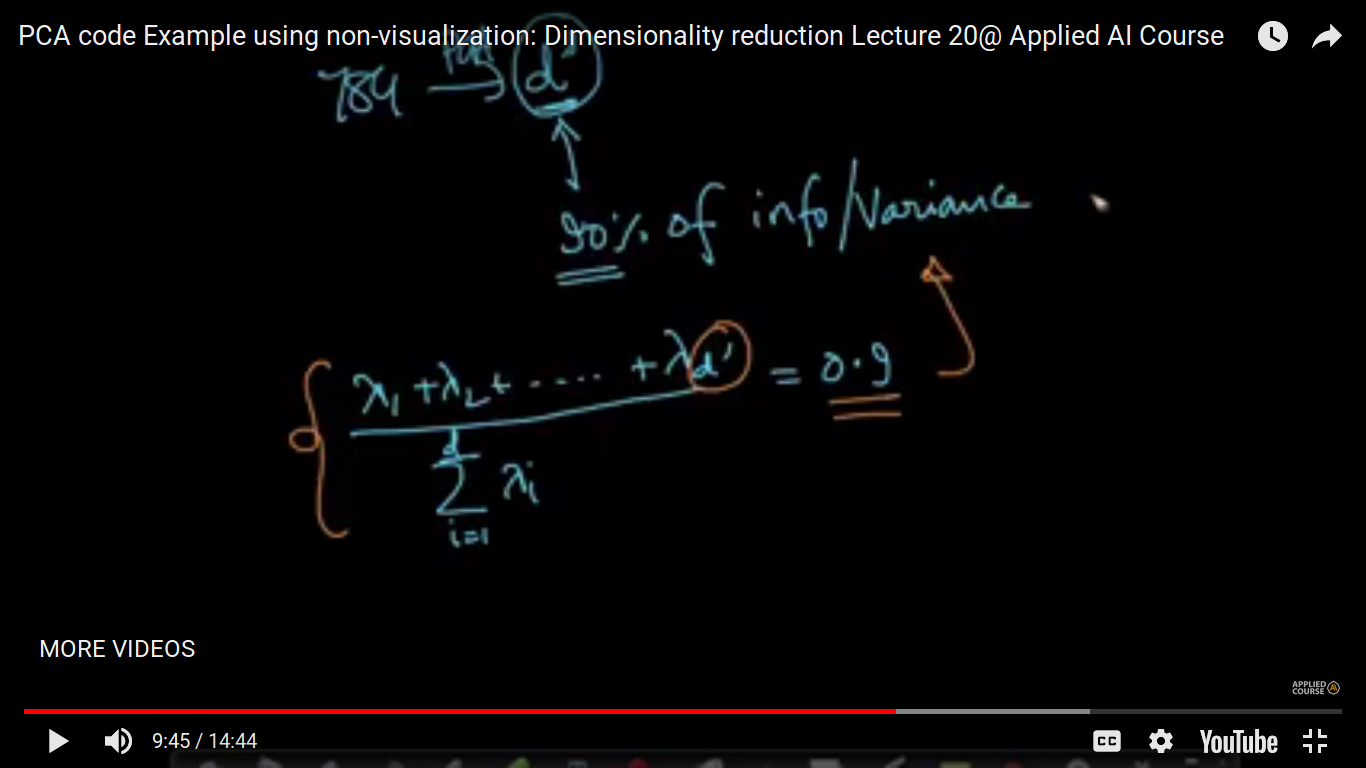
We have to choose d' such that we can be retained 95 percent of the information/Variance. And it is calculated by (lambda1-lambda-d')/(lambda1-lambda-d) = 0.9.
Q:
Using PCA we are deriving new features using the original features. Suppose I want to get features that explain at-least 90% of the variance. And from the plot, I get that about 300 new features derived using PCA give me 90% information of the variance.
Whats next?
Will, I use these new features in my ML model,
or will I find the corresponding features from the original features using these new features(300 features that give 90% information of variance) and then use the original features in the ML model? – is it possible to find the corresponding original features?
Will there be any difference in my ML model using the new features Vs using the corresponding original features?
Answer:
1. Using the 300 features in your ML model is one option if you intend to use this for ML models.
2. The 300 features we get do NOT have a 1-1 relationship with the initial set of features.
3. Some ML models (like decision trees) work well when the dimensionality of data is small. In such a case, using the 300-dim is a better option. Others, like Logistic regression, do not care about the dimensionality as much in which case, using the original features is better.
Informações
- Descrição
- Notas sobre Principal Component Analysis, criado por Rohit Gurjar em 12-08-2018.
- Criado por
- Rohit Gurjar
- Visualizações
- 23
- Avaliação