
Quiz
Further Regression Analysis
Este quiz tem tipos de pergunta que abrem no player de sempre.
Perguntas do quiz (13)
1Simple Linear Regression
- we assumed that errors about the line are [blank_start]normally[blank_end] distributed with mean [blank_start]0[blank_end] and constant variance > we now see how to check whether these assumptions are valid
correlation
- linear regression - predict [blank_start]response[blank_end] variable (Y) without our explanatory variable (X)
- we can predict the response variable with the equation of a [blank_start]straight[blank_end] line
- alpha = intercept, where the line crosses the [blank_start]y[blank_end] axis
- beta = coefficient of explanatory x, the [blank_start]slope[blank_end] of the line
- epsilon = errors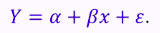
- Anormally
- B0
- Cresponse
- Dstraight
- Eslope
- Fy
2IN minitab
- we can fit a straight line using > stat > regression > fitted line plot
- we select our y-variable (male lobster weight for example, the [blank_start]response[blank_end] variable we are trying to predict), and our x-variable (male lobster length, the predictor/explanatory variable)
- we are trying to predict the weight of our lobsters by the [blank_start]length[blank_end] of our lobsters
- we click on graphs, click four in one and select standardise [blank_start]residuals[blank_end]
output
- focus on top 2 plots = check normality = errors should fit the line, variance = should be evenly scattered around [blank_start]0[blank_end]
if there is a problem with either of the plot, then we need to consider a different model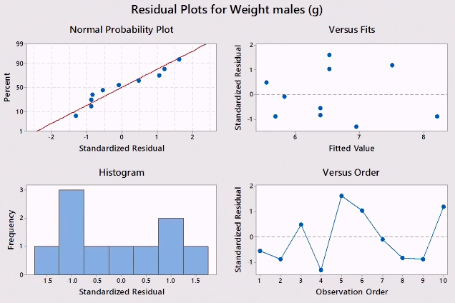
- Aresponse
- Blength
- Cresiduals
- D0
3Interpretation of female lobsters
- the normality plot is fine, but the plot of the [blank_start]residuals[blank_end] against the fitted values has a pattern > above the line, below the line, above the line; suggesting a more complex model might fit better
a better model might be a [blank_start]quadratic[blank_end] curve...fitting a quadratic model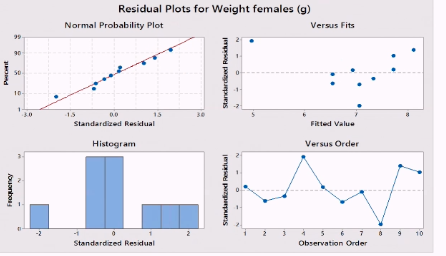
- Aresiduals
- Bquadratic
4A [blank_start]quadratic[blank_end] model: more complex model
- still using same x variable (female length)
- instead of just having intercept, [blank_start]slope[blank_end], and error term we also have an extra term
- X^2 which will give the curve
stat > regression > fitted line plot
- Aquadratic
- Bslope
5Minitab provides an analysis of variance table: doing hypothesis tests
- linear term and quadratic term
- the crucial term for deciding if you need a quadratic model is the p value for the quadratic term
- if the p value is [blank_start]big[blank_end], we do not need a quadratic term
- if the p value is [blank_start]small[blank_end], we do need it, the quadratic term significantly improves the fit of the line
Big p value = we do not that term
P = 0.016 < 0.05 (always test at the [blank_start]5[blank_end]% significance level), so we do need this quadratic term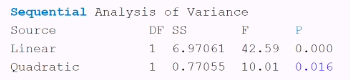
- Abig
- Bsmall
- C5
6[blank_start]Influential[blank_end] points
- a small number of points can have a big effect on regression lines
- e.g. a very small, very short lobster
- can remove these points and retest
as the p value is now big (0.149 > 0.05) the quadratic term does [blank_start]not[blank_end] significantly improve the fit to the data, and a straight line should be used
- having removed the quadratic term, you must fit the simpler model and check the residuals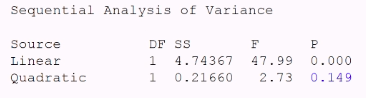
- AInfluential
- Bnot
7Extra predictor variables
- we have seen how we can see if we need a quadratic term, similarly, if there are several possible [blank_start]predictor[blank_end] variables e.g. temperature, humidity etc. we can see which ones are needed by looking to see if they significantly improve the fit
- we can use sequential ANOVA or [blank_start]t[blank_end]-tests on the fitted coefficients to decide what terms to include
- for example, log urate in the blood of men was thought to be related to BM1, alcohol consumption and age
- we use STAT > REGRESSION > REGRESSION > FIT REGRESSION MODEL
we thus imput log urate as the response and BMI, alcohol and age as continous predictors
trying to predict log of urate using
- BMI
- alcohol consumption
- age
[blank_start]response[blank_end] = think we are trying to predict, continuous predictors = things we are changing- Apredictor
- Bt
- Cresponse
8Multiple Regression Example
- p-values test if any of these coefficients are significantly different from [blank_start]0[blank_end] or not
- we need to look for big p values e.g. Age = 0.612 > 0.05 ([blank_start]5[blank_end]% significance level)
- age is not helping us predict log urate > age does [blank_start]not[blank_end] improve the prediction of log urate in males (its coefficient is not significantly different from 0)
- age should be removed (or any coefficients with p values above 0.05) and the model refitted
- this gives
gives [blank_start]regression[blank_end] equation again = intercept term + BMI male + alcohol male
as the p values for BMI and alcohol are both very [blank_start]small[blank_end] (P<0.001) both are important in predicting log urate levels in men (i.e. there coefficients are significantly different from 0)
- as both coefficients are [blank_start]positive[blank_end], we see that log urate increases as BMI increases and as alcohol consumption [blank_start]increases[blank_end]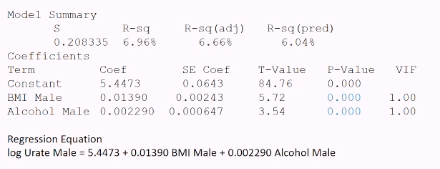
- A0
- B5
- Cnot
- Dregression
- Esmall
- Fpositive
- Gincreases
9Comparison of Regression Lines
- why might you want to compared [blank_start]regression[blank_end] lines?
- if we fit straight lines in male and female lobsters (reduced data set, influential point of small female taken out) for weight against length we can ask:
> are the slopes significantly [blank_start]different[blank_end]
> are the intercepts significantly different- Aregression
- Bdifferent
10How do we compare regression lines: stack all the data all in one column
- this plot suggests the intercepts are different but the slopes may [blank_start]not[blank_end] be
- to compare the lines, we [blank_start]stack[blank_end] the column so that all the weights are in one column (male and female) and all the lengths in another
- we generate a new column (sex) which is [blank_start]0[blank_end] for males and 1 for females
- we generate another column (an interaction between sex and length) > zero for males and length for females (female length); it only exists the lobster is female
- we first fit length and sex > this fits different intercepts and a common slope (i.e. parallel lines)
- we input weight as our response, length as a continuous predictor and sex as a categorial variable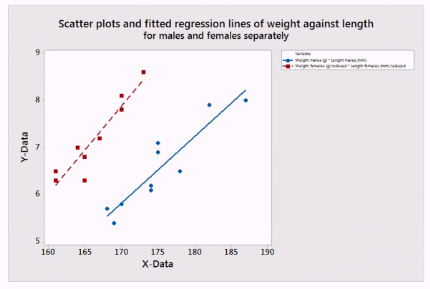
- Anot
- Bstack
- C0
11The output:
- gives up the analysis of variance table and the coefficient table in which the [blank_start]p[blank_end] values are the same
- coefficient table gives values of coefficient terms and regression equation
what this says:
- if the lobster is male (0) = then we are predicting our weight as some intercept + our coefficient x [blank_start]length[blank_end]
- if the lobster is [blank_start]female[blank_end] (1) = then we are predicting our weight as some intercept + our coefficient x length
can see these are parallel lines because the slopes are the [blank_start]same[blank_end], the intercept is different only (how shifted they are in y direction)
the p values test whether the regression coefficients are significantly different from 0
- as the p-value for 'sex' is very [blank_start]small[blank_end] (P<0.001) it suggests that the intercepts differ as the p value for length is also very small, it suggests that the common slope is different from 0
now we want to test if the slopes differ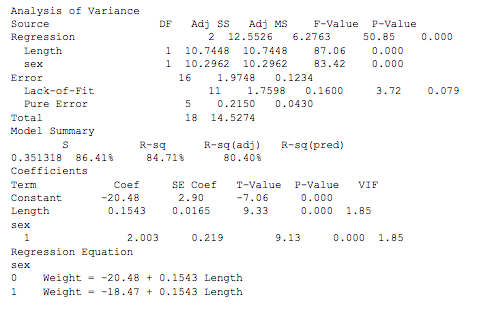
- Ap
- Blength
- Cfemale
- Dsame
- Esmall
12Do the slopes differ?
- we now additionally fit the female length column and see if its coefficient is significantly different from zero, to test if the slopes differ (interaction between sex and length)
- we get:
female length is added as continous predictor
- p value of 0.220 = as the p value for female length is [blank_start]big[blank_end] > the slopes are not significantly different between sexes and so we select a model with 2 [blank_start]parallel[blank_end] lines
- NB: adding the unnecessary term, female length, has distorted the p value for sex but we know from above that we need sex in the model
so take term back out, and stick with first model with 2 parallel lines (slopes the same)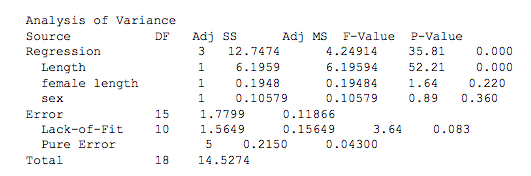
- Abig
- Bparallel
13Parallel Line Model
- same slope for both males and females could write 2 ways
intercept is the only thing that differs between the sexes
always check your assumptions, [blank_start]normal[blank_end] distribution and equal variance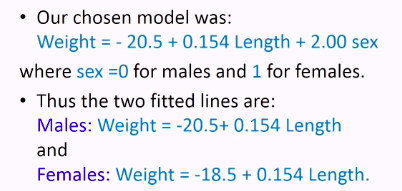
- Anormal
Informações
- Descrição
- Stats Quiz sobre Further Regression Analysis, criado por sophie waddington em 09-01-2019.
- Autor
- sophie waddington
- Idioma
- English
- Visualizações
- 0
- Etiquetas
- Avaliação
- Ainda sem avaliações Avalie este quiz