2218181
Question 1
Question
T-test are useful for detecting what kind of effect? BEST RESPONSE
Answer
-
An association between variables.
-
A difference between two means.
Question 2
Question
Select ALL TRUE statements.
Answer
-
Unlike methods such as regression and correlation methods such as ANOVA and t-tests allow us to make casual inferences.
-
Unlike methods such as ANOVA and t-tests methods such as regression and correlation allow us to make casual inferences.
-
Each of these tests mentioned can be considered mathematically identical.
-
The type of statistical test is not what is relevant to causal inference. It's the fact that in experiments we manipulate the causal variable systematically to see it's effect on an outcome.
-
In correlational research we observe the co-occurrence of variables, we do not manipulate the causal variable then measure the effect on the outcome. Therefore we cannot compare the effect of when the causal variable is present against when it is absent. Thus we cannot say which variable causes a change in the other, we can only say that both variables co-occur in a certain way.
Question 3
Question
An independent design (alternatively between-groups or between-subjects design) is
Answer
-
an experimental design in which different conditions utilise different (organisms etc). (e.g in psychology this would mean using different people). As such the resulting data can be considered independent.
-
an experimental design in which different conditions utilise the same organisms. (e.g in psychology this would mean using the same people to take part in two experimental conditions).
-
an experimental design in which all variables can be considered independent (i.e there are no dependent variables)
Question 4
Question
A repeated measures design (alternatively, a within-subjects design) is
Answer
-
an experimental design where different conditions utilise the same organisms (i.e. in psychology such a design would mean that the same people take part in all experimental conditions). As such the resulting data are related.
-
an experimental design in which different conditions utilise different organisms. (e.g in psychology this would mean that different conditions conducted on different people.
-
A design that only utilises independent variables.
-
A design that only utilises dependent variables.
Question 5
Question
Median splits, i.e dividing people into groups based on the median is generally a good idea.
Answer
- True
- False
Question 6
Question
An experiment that compared the ratings of a film where one group of participants were subjected to small electric shocks compared to a control group who just watched the film could be considered a
Answer
-
Repeated measures design
-
Within-subjects design
-
Independent design
-
Between-subjects design
Question 7
Question
What are the problems with NHS tests for normality (Kolmogorov-Smirnov) and homogeneity of variance (Levene's)
Answer
-
WRITE OUT ANSWER AND CHECK IN THE TEXT BOOK. pp184
-
REVISE AT THE END OF THE TEST.
Question 8
Question
A t-test can be explained in terms of linear regression.
Answer
- True
- False
Question 9
Question
What is the difference between independent and paired samples t-test?
Answer
-
Independent-samples t-test -- This test is used when there are two experimental conditions and different participants are assigned to each condition.
-
Paired-samples t-test -- This test is used when there are two experimental conditions and the same participants took part in each condition.
-
Independent-samples t-test -- This test is used when there are two experimental conditions and the same participants took part in each condition.
-
Paired-samples t-test -- This test is used when there are two experimental conditions and different participants are assigned to each condition.
Question 10
Question
Which of the following are other names for a paired-samples t-test?
Answer
-
Matched-pairs t-test
-
Dependent t-test
-
Independent measures t-test
Question 11
Question
T-tests: If samples come from the same population, then we expect their means to be roughly equal. Although it is possible for their means to differ by chance, we would expect large differences in their means to occur very infrequently. Under null hypothesis significance testing we assume that the experimental manipulation has no effect on the participants; therefore we expect that the sample means to be very similar.
Answer
- True
- False
Question 12
Question
T-tests: We compare the difference between the sample means that we collected to the difference between sample means that we would expect to obtain if there was no effect. We use the standard error as a gauge of the variability between sample means.
Answer
-
If the standard error is small, then we would expect most samples to have very similar means. However if the standard error is large, then it is possible that larger differences between means might occur due to chance.
-
If the standard error is small, then it is possible that larger differences between means might occur due to chance. However if the standard error is large, then we would expect most samples to have very similar means.
Question 13
Question
If the difference between the samples we have collected is larger than we would have expect based on the standard error then we can assume one of two things:
There is no effect and we have, by chance, collected two samples that are atypical of the population from which they came. OR The two samples come from different populations but are typical of their respective parent population. In this scenario, the difference between samples represents a genuine difference between the samples (and so the null hypothesis is unlikely).
The larger the difference becomes between the two sample means:
Answer
-
The more confident we become that the second hypothesis is correct. If the null hypothesis is incorrect, the we gain confidence that the two sample means differ because of the different experimental manipulation imposed on each sample. (causal inference)
-
The more confident we become that the first hypothesis is correct. If the null hypothesis is correct, and thus we have no evidence to infer that the two sample means differ because of the different experimental manipulation imposed on each sample.
Question 14
Question
A t-statistic is equal to
Answer
-
(The observed difference between the two means minus the expected difference between the two means (if there was no effect)) divided by the estimate of the standard error of the difference between two sample means.
-
(The observed difference between the two means minus the expected difference between the two means (if there was no effect)) divided by the estimate of the standard error of the combined sample mean
-
(The estimate of the standard error of the difference between two sample means) divided by the observed difference between the two means minus the expected difference between the two means (if there was no effect).
-
(the standard error of the combined sample mean) divided by the observed difference between the two means minus the expected difference between the two means (if there was no effect).
Question 15
Question
When different participants participate in different conditions, pairs of scores will differ not only because of the experimental manipulation, but also because of other sources of variance (such as individual differences in age, IQ etc).
This statement applies to:
Answer
-
Independent t-test
-
Paired-samples t-test
Question 16
Question
To compute a t statistic you do not actually need any raw data, it can be computed with simply the means, standard deviations and sample sizes.
Answer
- True
- False
Question 17
Question
The standard error of the difference refers to
Answer
-
The variability of groups in the population
-
The sampling error of the mean
-
The standard deviation of the sampling distribution of the mean
-
The standard deviation of a sampling distribution of differences between means.
-
A measure of variability of differences between sample means.
-
A measure of the unsystematic variation within the data.
-
A measure of the systematic variation within the data.
Question 18
Question
We divide by the standard error because:
Answer
-
It standardises the average difference between conditions so that we can compare t statistics without having to worry about the scale of measurement used to measure the outcome variable. That is two t-statistics are comparable even if they come from different experiments.
-
It contrasts the difference between means that we have, against the difference that we could expect to find given how well the samples represent to populations from which they came.
-
It contrasts the difference between means that we have, against the alpha level and thus provides a measure of the probability that the difference occured by chance.
Question 19
Question
T-statistics are cool.
Answer
-
A t statistic is simply a ratio of the systematic variation in the experiment to the unsystematic variation.
-
A t statistic is simply a ratio of the systematic variation in the experiment compared to the differences between observed and expected values.
Question 20
Question
T statistics are still cool.
Answer
-
If the experiment creates any kind of effect, then we would expect the systematic variation to be greater than the unsystematic variation and thus (at the very least) the T statistic should be greater than 1.
-
If the experiment creates any kind of effect, then we would expect the unsystematic variation to be greater than the systematic variation and thus (at the very least) the T statistic should be greater than 1.
-
T statistics are always less than 1.
Question 21
Question
Which of the following is accurate?
Answer
-
SSm (Model Sum of Squares): The proportion of the variance explained by the model.
-
SSm (Model Sum of Squares): equals SSt-SSr
-
SSm (Model Sum of Squares): The difference between the mean line and the regression line for all values of x.
-
SSr (Residual Sum of Squares): The proportion of variance not accounted for by the model.
-
SSr (Residual Sum of Squares): The sum of all deviations from the regression line squared.
-
SSr (Residual Sum of Squares): The sum of all deviations from the mean squared.
-
SSt (Total Sum of Squares): The sum of all deviations from the mean squared.
-
SSt (Total Sum of Squares): The total variance in the data
-
SSt (Total Sum of Squares): SSr+SSm
-
SSm (Model Sum of Squares): The sum of all deviations from the regression line squared.
Question 22
Question
What is OLS?
Answer
-
Ordinary Least Squares Regression
-
Ordinary Leveraged Sum of Squares Regression
-
Ordinal Least Squares Regression
Question 23
Question
OLS predicts the regression line by
Answer
-
calculating the line that will have the lowest residual sum of squares.
-
calculating the line that will have the lowest model sum of squares.
-
calculating the line that will have the lowest total sum of squares.
Question 24
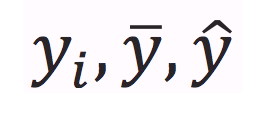
Answer
-
An observed value of y, the mean of y, a predicted or estimated value of y
-
The mean value of y, a predicted or estimated value of y, an observed value of y
-
The mean value of y, an observed value of y, a predicted or estimated value of y
-
A predicted or estimated value of y, the mean value of y, and observed value of y
Question 25
Question
In regression R squared is a measure of
Answer
-
How well the regression line fits the observed data.
-
The proportion of variance explained by the regression line
-
The correlation between the x values and y values
-
The proportion of variance explained by the co-variance as scaled by the standard deviation
Want to create your own Quizzes for free with GoConqr? Learn more.