Description
|
|
Created by Kyle Simpson
over 9 years ago
|
|
Page 1
T-Test
T-test is a inferential statistical test that compares the means of two samples. It is preferable to a z test for instances in which the real standard error is not known. Estimated standard error is used, computed from the sample variance and provides an estimate of the standard distance between a sample mean M and the population mean u. The General Formula for t is: t = (the sample statistic - population parameter) / estimated standard error. This holds for a Single Sample T-test. Effect Size (Cohen's d): d = Mean Difference/Sample SD (s = √(SS/df)) Small Effect: d=0.2; Medium Effect: d=0.5; Large Effect: d=0.8
Paired Sample T-test (within subjects design) - differences of subjects in 2 conditions. Compares the means of two variables Calculates case by case difference scores Tests to see whether average difference > 0 Difference (D) of the scores of the subject in two conditions used to calculate SS for Estimated Standard Error. Calculate ΣD, (ΣD)2, ΣD2, & M for each condition Calculate SS: SS = ΣD2 – ((ΣD)2/N) Calculate variance (s2): s2 = SS/(n-1) Calculate estimated standard error (smD): smD = √(s2/n) Calculate t: t = MD/smD d = sample mean difference / sample standard deviation r2 = t2 / (t2+df) (r squared = % of variance accounted for)
Independent Samples T-test (between subjects design) - Compares means of 2 groups on one variable. Estimated error calculated via the pooled variance between the groups. Calculate ΣX, ΣX2, & M for each group Calculate Sum of Squares (SS) for each group Calculate Pooled Variance: (s2p): s2p = (SS1 + SS2) / ((n1-1) + (n2-1)) Estimate standard error (s(m1-m2)): s(m1-m2) = √((s2p / n1)+(s2p / n2)) Calculate difference between the mean scores of the two groups Look on t-distribution table for closest df (always use the lowest of two options) Effect size (Cohen’s d) d = mean difference / standard deviation SD = √(pooled variance) r2 = t2 / (t2+df) Levene's Test for Equality of Variance: If not significant that means the variances are not statistically significant (this is good).
Page 2
One way ANOVA
In ANOVA, the variable that designates the groups being compared is called a factor – The individual conditions that make up a factor are called the levels of the factor.•NOTE: based on variance not mean differences Cannot compute sample mean differences with more than two samples
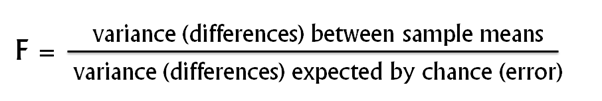
Between Treatments VarianceBetween-Treatments variance: How much difference exists between treatment conditions? Possible explanations for differences: • Treatment effect: Differences caused by the treatments • Chance: Differences due to chance • Individual DifferencesWithin-Treatments variance: Variability inside each treatment conditionProvides a measure of how much difference is reasonable to expect by chance.
Notational keys: k = the number of treatment conditions n = number of scores in each treatment N = total number of scores in the study T = total for each treatment condition (ΣX) G = sum of all the scores in the study (Grand Mean) SS = sum of squares (ΣX2) df = degrees of freedom S2 = variance = SS/df
Independent Measures ANOVA (Between Subjects) Calculate ΣX, (ΣD)2, ΣD2, & M for each condition
Page 3
Factorial ANOVA
Page 4
Summary
Design Test Formula SPSS Between Subjects Design: Independent Samples t (e.g. ‘Red Effect’: Adult Human Males’; LSD Running Speed in rats) t = (M1 – M2) / s(m1-m2) Analyse – Compare Means – Independent Samples t test Within Subjects Design: Paired Samples t (e.g. ‘Red Effect’: Macaques) t = (MD - µ) / smD Analyse – Compare Means – Paired Samples t-test Other: Single Sample t (e.g. Testing 2 Coins) t = (M – µ) / sm Compare means – One-Sample T Test – Test Value is ‘specific known value’
Want to create your own Notes for free with GoConqr? Learn more.