14154942
Description
Flashcards by María Marchante, updated more than 1 year ago
|
|
Created by María Marchante
over 7 years ago
|
|
| Question | Answer |
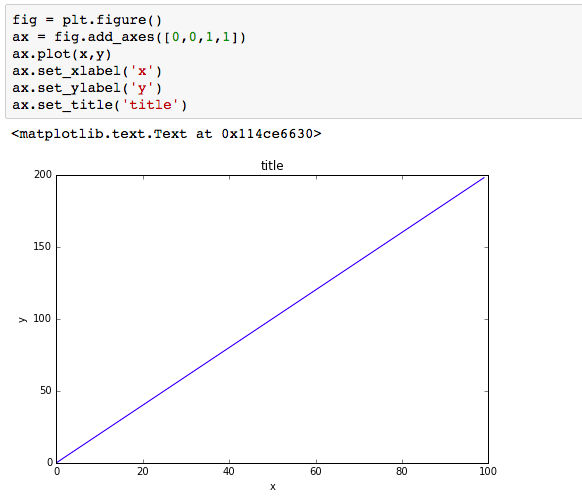
| Exercise 1 1. Create a figure object called fig using plt.figure() 2. Use add_axes to add an axis to the figure canvas at [0,0,1,1]. Call this new axis ax. 3. Plot (x,y) on that axes and set the labels and titles to match the plot below: | |
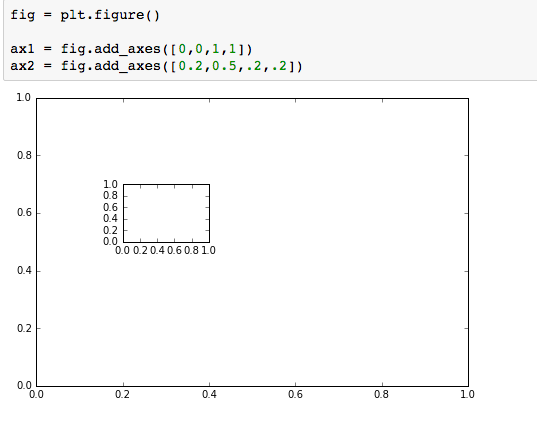
| Exercise 2.1 1. Create a figure object and put two axes on it, ax1 and ax2. Located at [0,0,1,1] and [0.2,0.5,.2,.2] respectively. | |
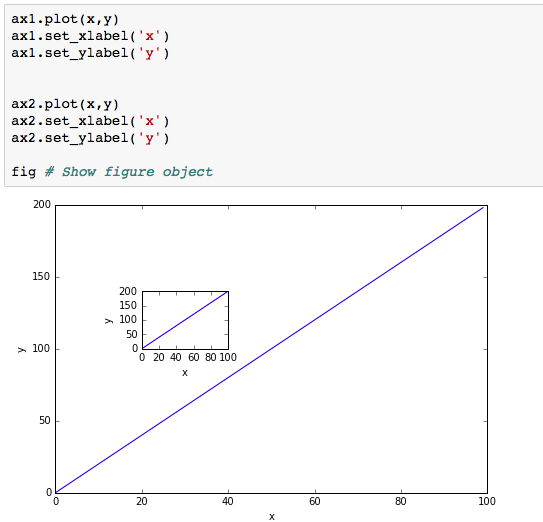
| Exercise 2.2 2. Now plot (x,y) on both axes. And call your figure object to show it. | |
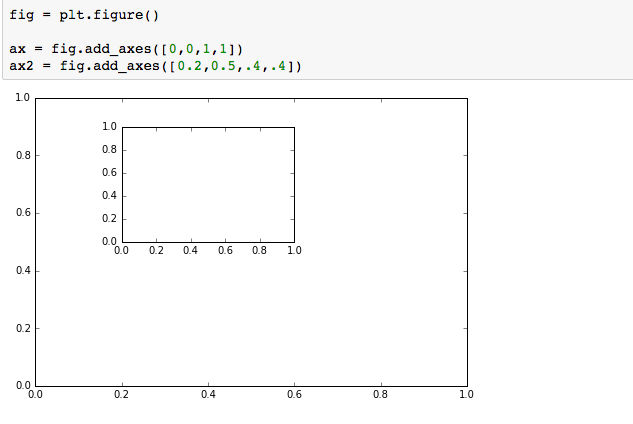
| Exercise 3.1 Create the plot below by adding two axes to a figure object at [0,0,1,1] and [0.2,0.5,.4,.4] | |
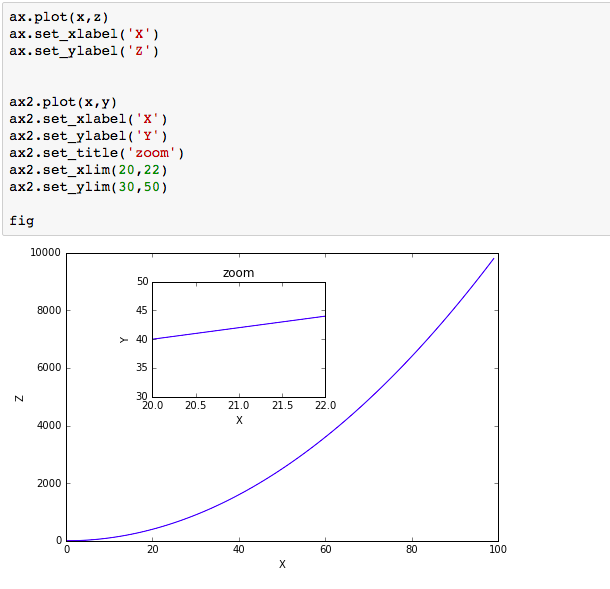
| Exercise 3.2 Now use x,y, and z arrays to recreate the plot below. Notice the xlimits and y limits on the inserted plot: | |
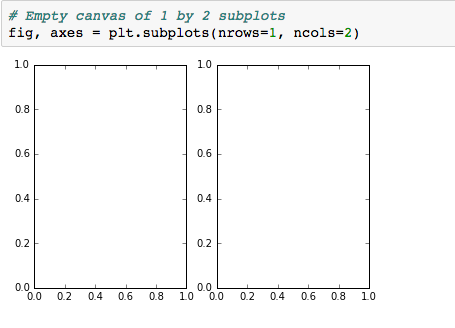
| Exercise 4.1 Use plt.subplots(nrows=1, ncols=2) to create the plot below. | |
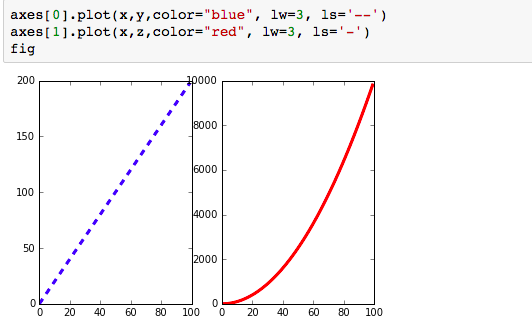
| Exercise 4.2 Now plot (x,y) and (x,z) on the axes. Play around with the linewidth and style | |
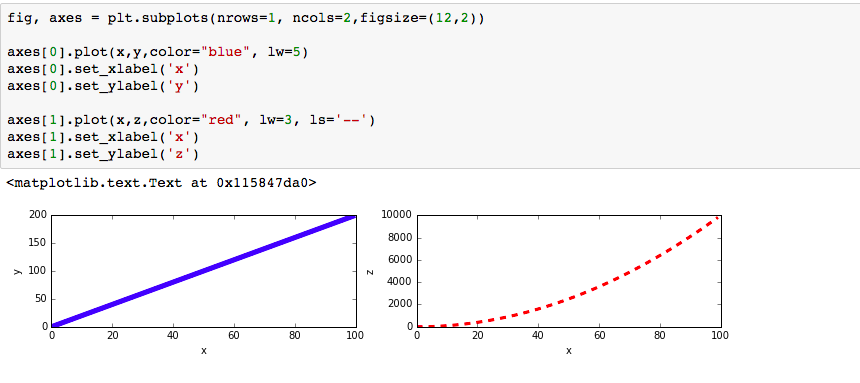
| Exercise 4.3 See if you can resize the plot by adding the figsize() argument in plt.subplots() are copying and pasting your previous code. |
Want to create your own Flashcards for free with GoConqr? Learn more.