
Karteikarten
F-test
Karten in diesem Stapel (24)
- 1Comparing two populations:• Means (t-test)
• Varience (F-test)
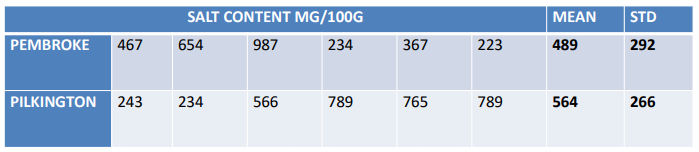
The F-test and T-test are accurate only for normally distributed data! - 2Examining the variances of two populations:Eating too much salt in our foods raises the blood pressure. We examined the salt
content in six main dishes (mg/100g) from the café in Pembroke and in Pilkington:
The averages salt content is higher in the food from Pilkington but is the variation greater
in one of the two cafes? - 3The F-testThe F-test is designed to test if two population variances
are equal. It does this by comparing the ratio of two variances.
• If the variances are equal, the ratio of the variances will
be 1.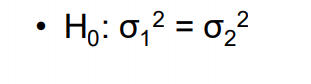
- 4Measures of VariationThe variation around the centre shows how closely the data is clustered
• the squared differences from the Mean
• If you were carrying out the same experiment a number of
times and you calculated the mean and the variation around
the mean, you would expect the variation to be quite small,
if not, then the experiment is not very reliable as it cannot be
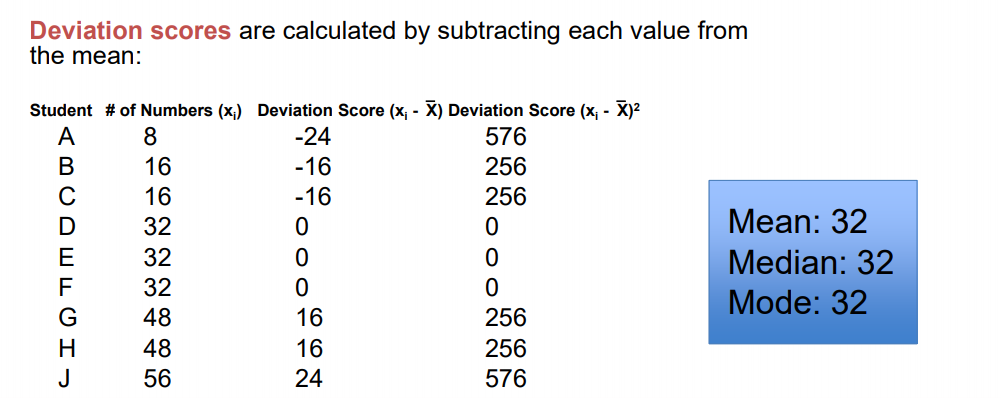
closely reproduced each time - 5Measures of Variation • There are three different ways to measure the variation:– Deviation scores are the distances between each data point and
the mean.
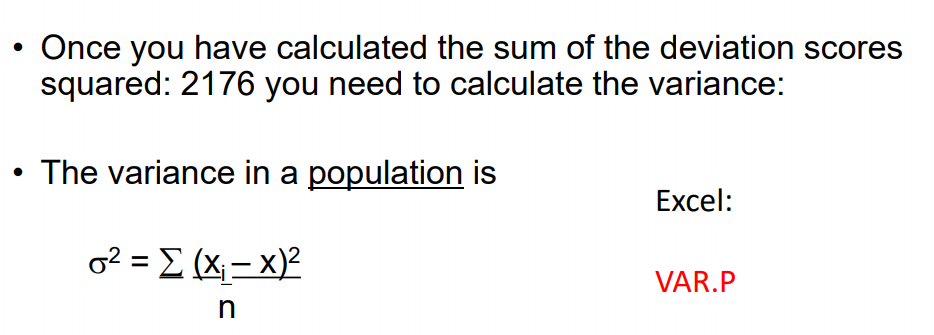
– Variance is a measure of how spread out a distribution is. It is
computed as the average squared deviation of each number from
its mean.
– Standard deviation is the square root of the variance. - 6Deviation Scores
- 7Variance
- 8Populations and samples Taking a sample from a population
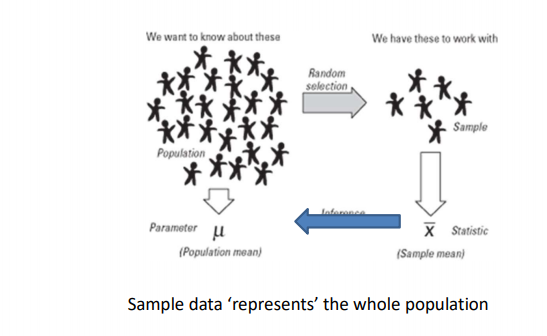
- 9Variance
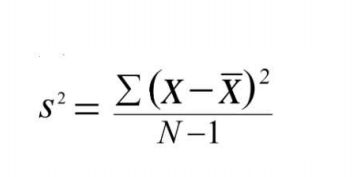
- 10Standard deviation Sample standard deviation
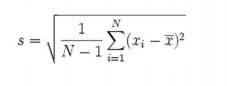
- 11Standard deviation Population deviation
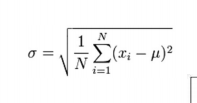
- 12Standard deviation
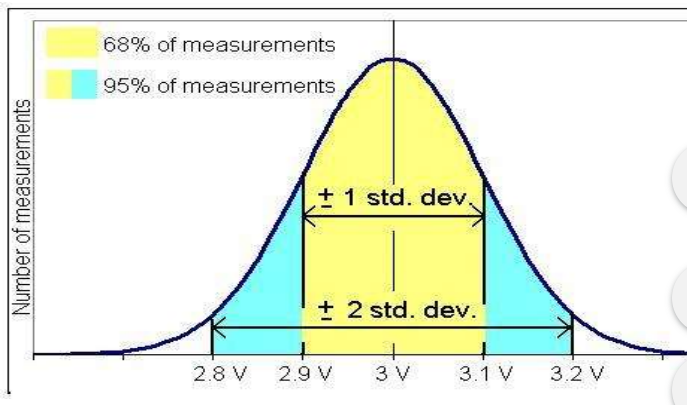
- 13example
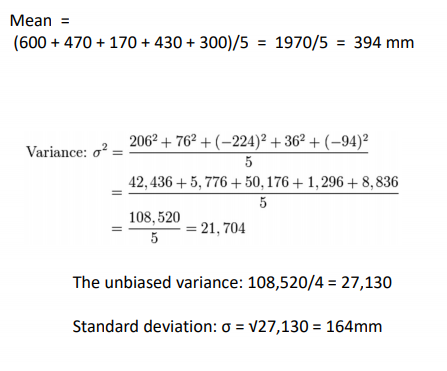
- 14The F-test Assumptions
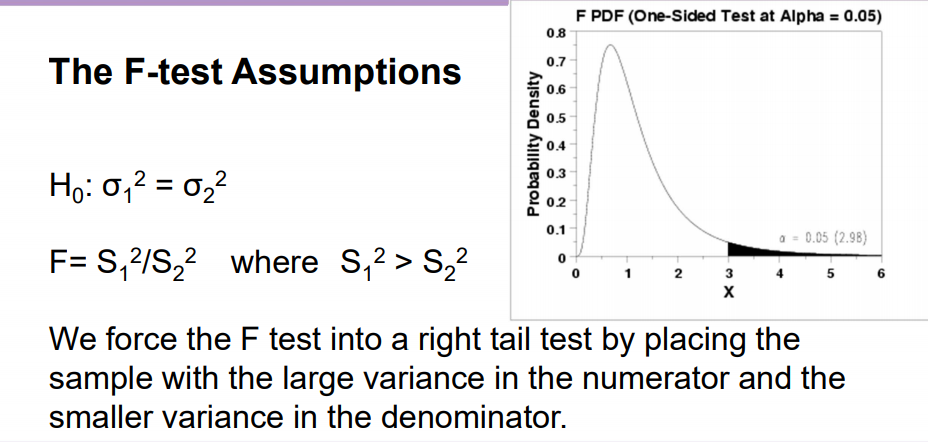
- 15The F distribution
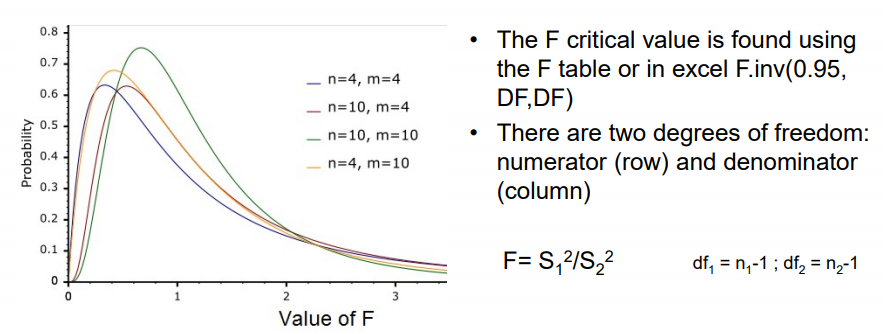
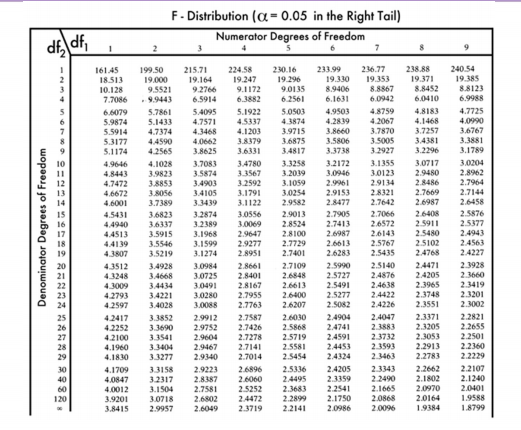
- 16F distribution table of values
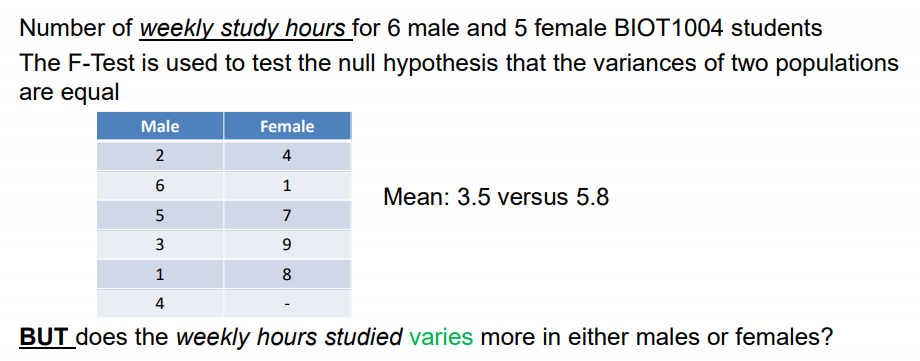
- 17how do we use the Ftest to compare the variance between two samples? Example
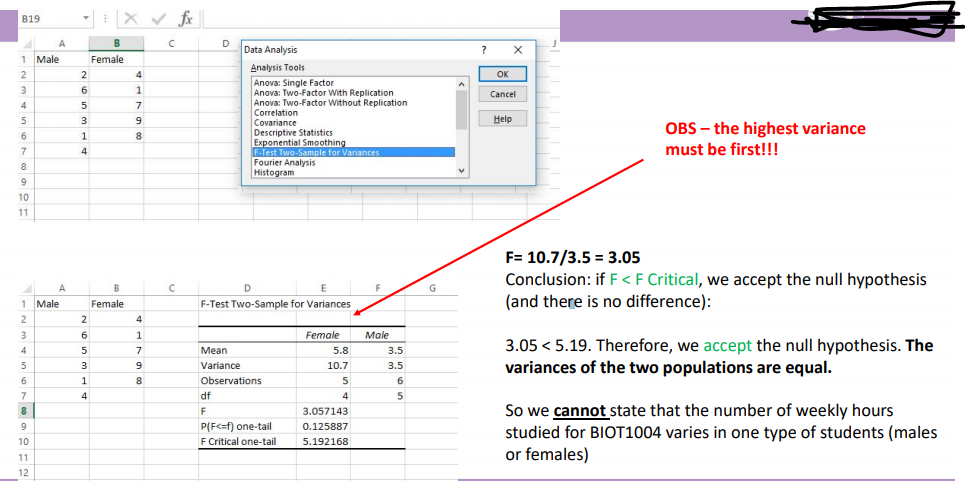
- 18how do we use the Ftest to compare the variance between two samples? Example
- 19Example 2: Process 1 VS Process 2

- 20Example 3Considering the following measurements of the
heat producing capacity of the coal produced by
two mines (in millions of calories per ton)
Mine 1: 8260, 8130, 8350, 8070, 8340
Mine 2: 7950, 7890, 7900, 8140, 7920, 7840
Is the variance equal? - 21Conclusions 1) Remind ourselves what variance isMeasure of spread in a data set
- 22Conclusions • 2) Identify why you would use an F-testTo test for equality of variances
- 23Conclusions • 3) Identify conditions for an F-testData must be normally distributed
- 24Conclusions • 4) Interpret the results of an F-test

Informationen
- Beschreibung
- Karteikarten am F-test, erstellt von megan trent am 19/10/2020.
- Erstellt von
- megan trent
- Aufrufe
- 0
- Bewertung