
Karteikarten
STAT Chapter 2
Karten in diesem Stapel (40)
- 1Class frequency (f)The number of population members in that class
- 2Relative frequencyThe fraction of population members in that class
- 3Percent frequencythe percentage of population members on that class
- 4Sum of frequencies is always N (or n for a sample)Sum of relative frequencies is always 1
Sum of percent frequencies is always 100
Sum of pie chart angles is always 360 - 5Ways to display Quantitative DataStem and Leaf displays
Dot plots
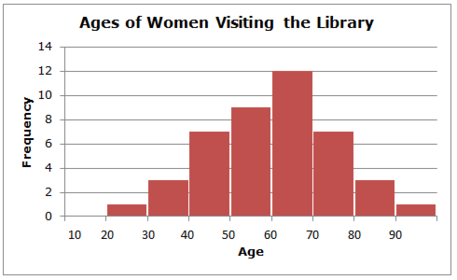
Histograms - 6frequency histogramseach bar height is the number of values in the interval under the bar
- 7percent histogramseach bar height is the percentage of values in the histogram under the bar
- 8relative frequency histogramseach bar height is the fraction of values in the interval under the bar
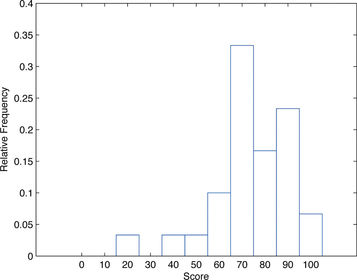
- 9Skewed Rightpeak on left, tail on right
- 10Skewed leftpeak on right, tail on left
- 11Symmetricbars on sides are reasonable mirror images
- 12uniformreasonably close to the same height
- 13Summation Notationused to denote the sum of some or all of the values of a subscripted variable
shorthand for x1+x2+x3+x4+x5...xn - 14meansum of all values in the sample or population/ the number of values (n or N)
- 15median 50th percentile 2nd quartilethe value in the middle of the sample or population after the data has been sorted in ascending order
- 16To find the median when n is odd(n+1)/2
- 17To find the median when n is evenaverage of n/2 and (n/2)+1
- 18modethe value in a sample or population that appears the most frequently
- 19first quartile Q1 25th percentilethe value such that (approximately) 25% of the values are below Q1, and approximately 75% are above
- 20third quartile Q3 75th percentilethe value such that (approximately) 75% of the values are below Q3, and approximately 25% are above
- 21inter-quartile range (IQR)Q3-Q1
a measure of how spread out the middle 50% of data is - 225 number summaryThe numbers min, Q1, Q2, Q3, and max
- 23percentileIf p is a number between 0 and 100, then the pth percentile of a sample or population is a value x such that p% of the data is below x, and (100-p)% of the data is at or above x.
- 24distribution/density curvea smooth curve that visually shows how the data in the population sampled from is "spread out" or "distributed" on the x axis
- 25rangemax-min
- 26varianceThe "average" of the square of the distance of each observation (value) from the mean
A measure of how spread out the data values are from the mean - 27standard deviationthe positive square root of the variance in the sample or population
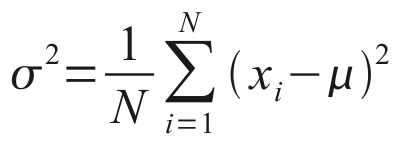
- 28formula for the population varianceThe variance is denoted by "sigma squared"
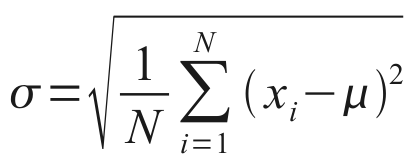
- 29formula for population standard deviationThe population standard deviation is denoted by sigma and is the positive square root of the variance
- 30formula for sample variancedenoted by s squared
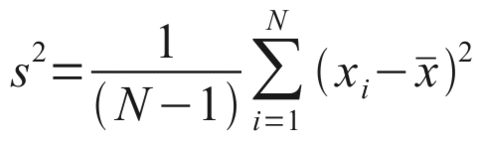
- 31formula for sample standard deviationdenoted by s
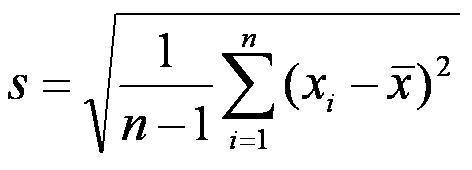
- 32Quick notes about variance/standard deviation1. if the xi tend to be close to the mean, the standard deviation will be small, and vice versa
2. Any data value x that is equal to the mean (x bar or mu) will not contribute anything to the standard deviation
3. The standard deviation has the same units as the population/sample data collected - 33classone of the categories into which qualitative data can be classified
- 34z scoreThe z-score of x is the number of standard deviations x is from the mean
denoted by "z" - 35z score formula for a population
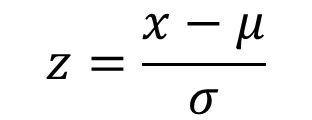
- 36z score formula for a sample
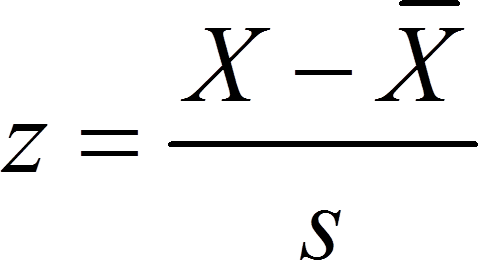
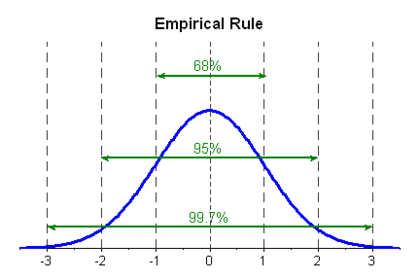
- 37empirical ruleThe empirical rule tells us that the approximate fraction of the data that is within 1, 2, and 3 standard deviations of the mean
- 38Chebyshev's Theoreman alternative to the empirical formula when shape of distribution is unknown or isn't bell shaped and symmetric
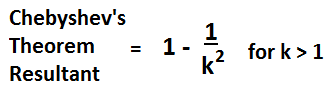
Tells us that the minimum fraction of data is within "k" standard deviations of the mean, for any value k>1 - 39Statement of Chebyshev's TheoremFor ANY sample or population of any shape whatsoever, the minimum fraction of data within 'k' standard deviation of the mean ( data with z-scores from -k to k) is:
- 40outliera data value that is unusually small or large relative to the other values in the sample or population
Informationen
- Beschreibung
- Karteikarten am STAT Chapter 2, erstellt von Brianna Nelson am 19/09/2015.
- Erstellt von
- Brianna Nelson
- Aufrufe
- 2
- Bewertung